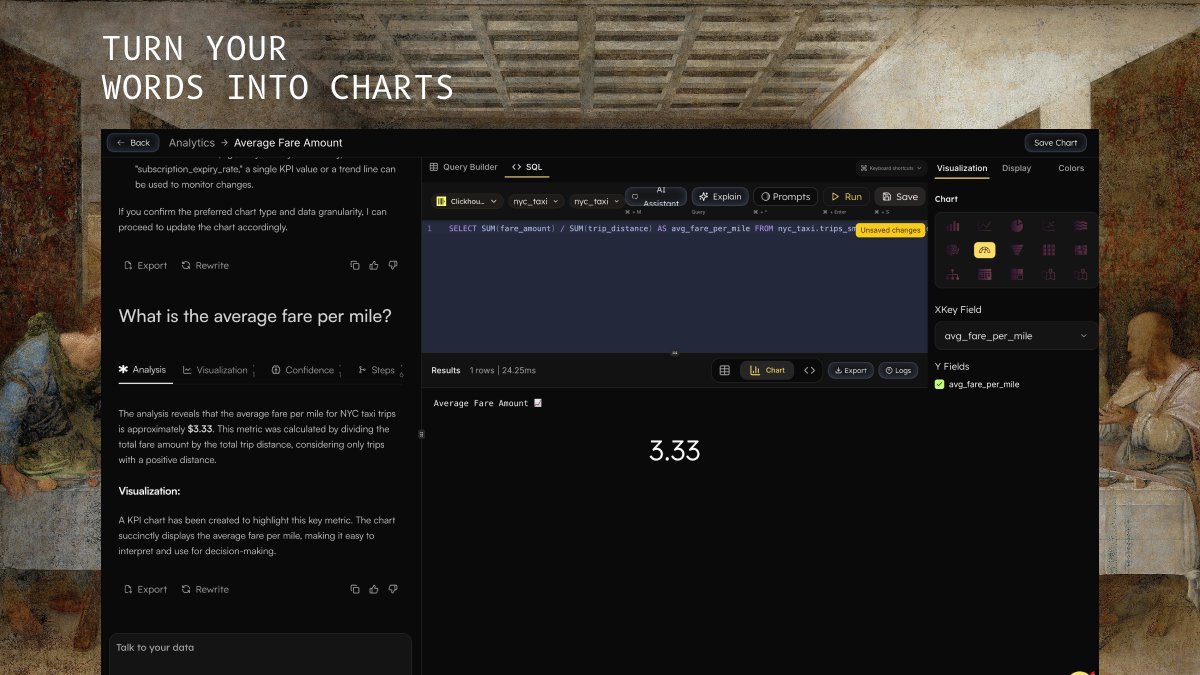
Transform your data exploration with visual query construction. No SQL required—just point, click, and analyze.
Overview
No Code Query Builder

What is the No-Code Query Builder?
What is the No-Code Query Builder?
The No-Code Query Builder is a visual interface that enables users to construct database queries through guided steps rather than writing code. It bridges the gap between technical and non-technical users by providing:
- Visual Query Construction: Build queries through point-and-click interface
- Natural Language Input: Ask questions in plain English
- Instant Results: See data immediately as you build
- SQL Transparency: View generated SQL for learning and refinement
- Save & Share: Preserve queries and visualizations for team collaboration
Who Should Use This Feature?
Who Should Use This Feature?
The Query Builder is designed for diverse user personas:Business Analysts
- Create reports without technical dependencies
- Explore data trends and patterns quickly
- Build dashboards for stakeholder presentations
- Analyze user behavior and product metrics
- Track feature adoption and engagement
- Generate insights for data-driven decisions
- Segment customer data for campaigns
- Track conversion metrics and attribution
- Analyze campaign performance across channels
- Learn query construction through visual guidance
- Understand SQL generation from visual inputs
- Graduate to advanced SQL writing with confidence
Core Features
Natural Language Analytics Panel
Conversational Data Exploration
Conversational Data Exploration
The prominent natural language panel enables intuitive data interaction:Ask Questions Naturally
- “What are our top-performing products this quarter?”
- “Show me user engagement trends over the past 30 days”
- “Which marketing channels drive the most conversions?”
- AI understands context and intent from your questions
- Automatically selects appropriate tables and columns
- Suggests relevant filters and aggregations
- Generates optimized SQL queries behind the scenes
- Ask follow-up questions to drill deeper
- Modify queries through conversation
- Get explanations of results and insights
Visual Query Construction
Step-by-Step Query Building
Step-by-Step Query Building
The visual builder follows a logical, guided workflow:1. Data Source Selection
- Choose your target database from connected sources
- Browse available databases with clear descriptions
- See connection status and data freshness indicators
- Pick the primary table for your analysis
- View table descriptions and row counts
- See column previews and data types
- Select specific columns to include in results
- Choose from available columns with data type indicators
- Add calculated fields and aggregations
- Rename columns for clearer output
- Apply conditions to narrow down results
- Use visual filter builders for different data types
- Combine multiple filters with AND/OR logic
- Preview filter effects before execution
- Add related data from other tables
- Visual join builder with relationship suggestions
- Support for INNER, LEFT, RIGHT, and FULL OUTER joins
- Join condition validation and optimization
- Set result ordering (ascending/descending)
- Configure row limits for performance
- Multiple sort criteria support
- Smart defaults based on data types
Advanced Configuration Options
Advanced Configuration Options
Aggregation & Grouping
- Group results by specific columns
- Apply aggregate functions (COUNT, SUM, AVG, MIN, MAX)
- Create calculated metrics and ratios
- Handle null values and edge cases
- Intelligent date range pickers
- Relative date filters (“last 30 days”, “this quarter”)
- Time zone conversion and formatting
- Date part extraction (year, month, day of week)
- Pattern matching and text search
- Case-insensitive comparisons
- String concatenation and formatting
- Regular expression support for advanced users
Execution & Results
Query Execution
Query Execution
Instant Execution
- Run queries with a single click
- Real-time result streaming for large datasets
- Progress indicators for long-running queries
- Cancellation support for resource management
- Automatic query optimization suggestions
- Row limit recommendations based on data size
- Index usage analysis and recommendations
- Query cost estimation before execution
- Clear error messages with suggested fixes
- Visual indicators for invalid configurations
- Rollback to previous working configurations
- AI-powered error resolution assistance
Result Visualization
Result Visualization
Multiple Display Formats
- Tabular data grid with sorting and filtering
- Interactive charts and graphs
- Summary statistics and data profiles
- Export options (CSV, JSON, PDF)
- Automatic chart type recommendations
- Customizable visualizations
- Interactive charts with drill-down capabilities
- Dashboard-ready widgets
- Automatic pattern detection
- Statistical summaries and distributions
- Anomaly highlighting
- Trend analysis and forecasting hints
Workflow Examples
Business Analytics: Checkout Event Analysis
Business Analytics: Checkout Event Analysis
Scenario: Analyze checkout events for the past month to understand conversion patterns.Step-by-Step Process:
- Data Source: Select “E-commerce Database”
- Table: Choose “events” table
- Columns: Select event_name, event_timestamp, user_id, product_id, revenue
- Filters:
- event_name = ‘checkout_started’ OR ‘checkout_completed’
- event_timestamp >= 30 days ago
- Grouping: Group by event_name and date
- Aggregation: Count events and sum revenue
- Sorting: Order by date descending
- Visualization: Generate conversion funnel chart
Customer Segmentation: User Behavior Analysis
Customer Segmentation: User Behavior Analysis
Scenario: Segment users based on engagement patterns and purchase history.Step-by-Step Process:
- Data Source: Select “Customer Database”
- Table: Start with “users” table
- Joins: Add “orders” and “sessions” tables
- Columns: user_id, registration_date, total_orders, session_count, last_activity
- Calculations: Create engagement_score and customer_lifetime_value
- Filters: Active users in last 90 days
- Grouping: Segment by engagement level
- Visualization: Create user segment distribution chart
Marketing Attribution: Campaign Performance
Marketing Attribution: Campaign Performance
Scenario: Analyze marketing campaign effectiveness across different channels.Step-by-Step Process:
- Data Source: Select “Marketing Database”
- Table: Choose “campaigns” table
- Joins: Connect to “conversions” and “costs” tables
- Columns: campaign_name, channel, impressions, clicks, conversions, cost
- Calculations: CTR, conversion_rate, ROAS, cost_per_acquisition
- Filters: Last quarter campaigns only
- Grouping: Group by channel and campaign type
- Sorting: Order by ROAS descending
- Visualization: Multi-metric performance dashboard
Advanced Features
SQL Transparency & Learning
SQL Transparency & Learning
Generated SQL Viewing
- See the SQL query generated from your visual configuration
- Learn SQL syntax through example
- Copy generated queries for manual editing
- Understand query optimization techniques
- Seamlessly switch between visual and SQL modes
- Edit generated SQL directly for advanced customization
- Visual builder updates when SQL is modified (where possible)
- Syntax highlighting and auto-completion support
- AI-powered explanations of query logic
- Performance impact analysis
- Alternative query suggestions
- Best practices recommendations
Collaboration & Sharing
Collaboration & Sharing
Save & Organize
- Save queries with descriptive names and tags
- Organize saved queries in folders and categories
- Version control for query iterations
- Duplicate and modify existing queries
- Share queries with team members
- Collaborative editing and commenting
- Role-based access control for sensitive data
- Usage analytics and adoption tracking
- Export results in multiple formats
- Schedule automated query execution
- Integrate with BI tools and dashboards
- API access for programmatic usage
Prompts & Templates
Prompts & Templates
Pre-built Prompts
- Industry-specific query templates
- Common business questions and patterns
- Best practice examples for different use cases
- Customizable prompt library
- Context-aware column and filter suggestions
- Join recommendations based on schema relationships
- Optimization hints for query performance
- Data quality warnings and recommendations
- Create custom templates for repeated analyses
- Share templates across teams
- Template versioning and updates
- Usage tracking and optimization
Getting Started
Quick Start Guide
Quick Start Guide
Step 1: Access the Query Builder
- Navigate to the Query Builder from the main dashboard
- Select “Visual Builder” mode if prompted
- Ensure you have proper database permissions
- Click in the natural language panel
- Type a simple question like “Show me all customers from last month”
- Review the generated query and results
- Refine using follow-up questions
- Start with data source selection
- Browse available tables and their descriptions
- Add a few columns and basic filters
- Execute your first visual query
- Save your successful query with a descriptive name
- Add tags for easy discovery
- Share with team members if needed
- Explore visualization options
Best Practices
Best Practices
Query Design
- Start simple and add complexity gradually
- Use filters early to reduce data volume
- Test with row limits before removing restrictions
- Document complex queries with descriptions
- Apply filters before joins when possible
- Use appropriate row limits for exploration
- Monitor query execution times
- Leverage suggested optimizations
- Use descriptive names for saved queries
- Add context and documentation for team queries
- Tag queries by project or use case
- Share insights and findings with stakeholders
Reference
Feature Comparison Table
| Feature | Visual Builder | Natural Language | SQL Editor |
|---|---|---|---|
| Ease of Use | ⭐⭐⭐⭐⭐ | ⭐⭐⭐⭐⭐ | ⭐⭐⭐ |
| Flexibility | ⭐⭐⭐⭐ | ⭐⭐⭐ | ⭐⭐⭐⭐⭐ |
| Learning Curve | Low | Very Low | Medium-High |
| Query Complexity | Medium-High | Medium | Unlimited |
| Speed for Simple Queries | Fast | Very Fast | Medium |
| Speed for Complex Queries | Medium | Medium | Fast |
Keyboard Shortcuts
| Action | Shortcut | Description |
|---|---|---|
| Run Query | Ctrl/Cmd + Enter | Execute current query configuration |
| Save Query | Ctrl/Cmd + S | Save current query and settings |
| Clear Filters | Ctrl/Cmd + K | Remove all applied filters |
| Switch to SQL | Ctrl/Cmd + Shift + S | Toggle to SQL editor mode |
| Add Column | Ctrl/Cmd + + | Add new column to selection |
| Remove Column | Ctrl/Cmd + - | Remove selected column |
Query Console
Switch to the advanced Query Console for SQL editing and complex operations
Data Sources
Connect your databases and data sources
Visualization
Create charts and dashboards from your queries