# Workflow Automation & Scheduling
Source: https://docs.synehq.com/features/automated-workflows
Gain superpowers for your analytics with SyneHQ’s Workflow Automation & Scheduling. Automatically run SQL queries, generate charts, and deliver results where your team needs them—on time, every time!
## What is Workflow Scheduling?
Workflow Scheduling lets you automate your data workflows. Just set up your query, pick how often it should run, and SyneHQ does the rest. No more manual refreshes or late-night updates!
![image.png]() ***
## Key Features
* **Automate Any SQL Query:** Schedule queries to run at your chosen frequency—daily, weekly, or custom times!
* **Timezone Support:** All scheduling is timezone-aware for global teams.
* **Smart Notifications:** Instantly notify your team via Slack or Email when results are ready.
* **Visualize Results:** Automatic charting of query results for easy analysis.
* **Export & Share:** Download charts and data or share links to results.
***
## How to Use Workflow Scheduling
First thing first navigate to `Sidebar > Workflows`
![2025-09-06_10-48-29.png]() Write your SQL as usual in the Query Editor. Need suggestions or explanations? Use the AI Assistant!
![2025-09-06_10-49-34.png]() On the right, configure:
* **Frequency:** How often to run your workflow (daily, weekly, etc.)
* **Timezone:** Select your preferred timezone.
* **Time:** Pick the exact hour/minute for execution.
Choose where to send results:
* **Slack:** Get notified in your Slack channels.
* **Email:** Send visuals & results to your inbox.
Click “**Save Workflow**” to start the schedule. Your workflow will now run automatically!
***
## Pro Tips
You can combine multiple queries into one workflow to get comprehensive insights, and results will include charts for all aggregations you specify!
Change your schedule anytime—just edit your workflow and save again. All future runs will use your new settings.
***
## Example Use Cases
* **Operations Dashboards:** Schedule daily cell tower coverage reports and get alerts for any anomalies.
* **Business Metrics:** Send weekly growth or usage summaries straight to business teams, no manual exports required!
* **Compliance & Audits:** Automate regular compliance checks and export required logs to email for safekeeping.
* **Collaborative Analysis:** Share charts and data updates with your product or engineering teams via Slack.
***
## FAQ
Yes! You’ll receive a notification via your selected channels if a scheduled run encounters errors.
Absolutely—just click “Edit” next to your workflow, make changes, and save. Or disable it whenever you need.
SyneHQ handles query timeouts gracefully. You’ll be notified if a run takes longer than expected.
***
## 🚀 Ready to Automate?
Set up your first workflow in SyneHQ and let the data come to you!
# SyneHQ Query Console
Source: https://docs.synehq.com/features/console
Natural language queries and intelligent data analysis
SyneHQ’s Query Console offers a unified interface for both technical and non-technical users, blending classic SQL workflows with modern AI-powered assistance, schema browsing, saved query organization, and robust error handling.
## 1. Core Query Interface
### Multi-Language Query Editors
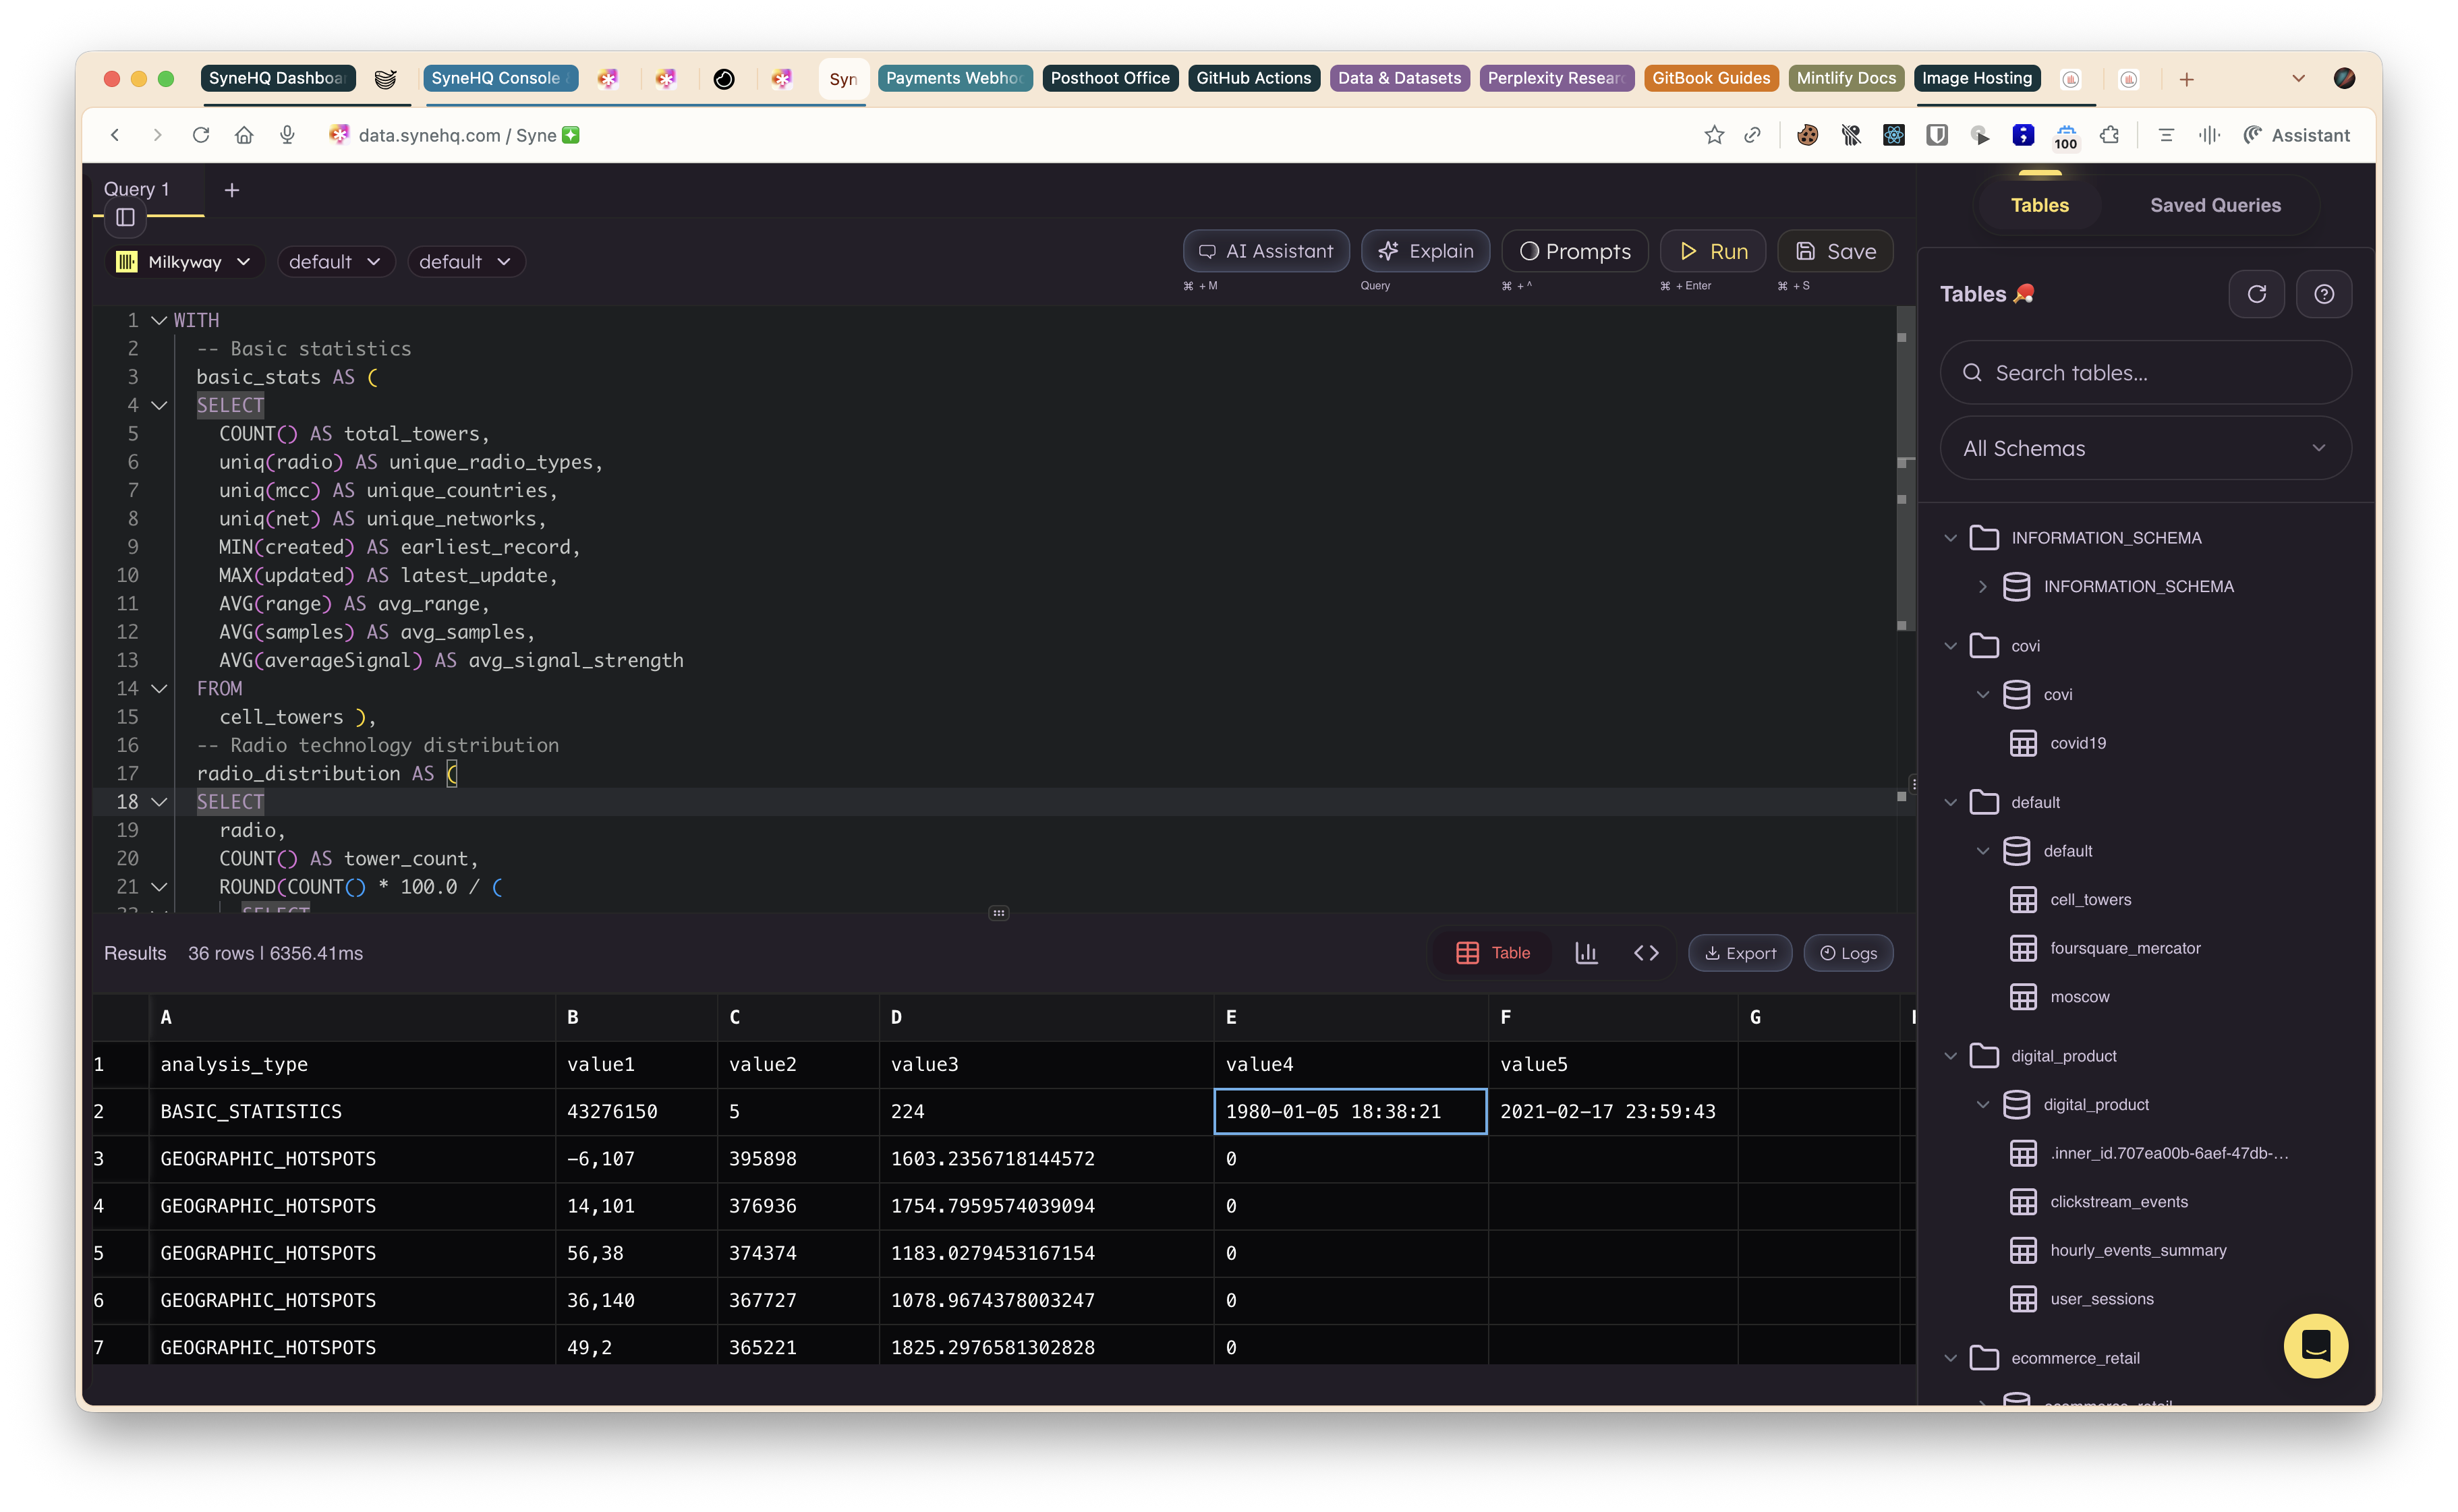
**SQL Editor**
* Full-featured SQL editor with syntax highlighting and auto-completion
* Write SQL directly or describe your data needs in plain English
* Keyboard shortcut `Ctrl/Cmd + M` to instantly access AI assistance
* Multi-line editing with intelligent indentation and bracket matching
* Query validation and syntax checking in real-time
**MongoDB Query Editor**
* Native support for MongoDB shell (mongosh) syntax
* Write aggregation pipelines, find queries, and complex operations
* Seamlessly switch between SQL and MongoDB query languages
* Full MongoDB operator support with intelligent suggestions

### Advanced Data Analysis Features
**Data Distribution Analysis**
Gain deep insights into your data patterns and quality:
* **Statistical Overview**: Unique value counts, null percentages, and data completeness metrics
* **Numeric Analysis**: Min/max values, mean, median, and standard deviation for numeric columns
* **Categorical Insights**: Most frequent values, distribution patterns, and cardinality analysis
* **Quality Indicators**: Automatic anomaly detection, outlier identification, and data validation warnings
**Intelligent Type Detection**
Smart data type recognition and formatting capabilities:
* **Automatic Schema Analysis**: Detects and suggests optimal data types for columns
* **Pattern Recognition**: Identifies format patterns for dates, phone numbers, emails, and URLs
* **Encoding Detection**: Automatically detects text encoding and character sets
* **Precision Analysis**: Analyzes numerical precision, scale, and recommended storage types
**Query Template Library**
Accelerate development with pre-built query patterns:
* **Table-Specific Templates**: Custom query patterns generated for each table structure
* **CRUD Operations**: Ready-to-use SELECT, INSERT, UPDATE, DELETE statement templates
* **Aggregation Patterns**: Pre-built templates for common aggregations based on column types
* **Best Practices**: Query structures following performance optimization guidelines
* **Business Logic**: Industry-specific query patterns for common use cases
### Query Execution & Performance
**Instant Results Display**
* Execute queries with a single click or keyboard shortcut (`Ctrl/Cmd + Enter`)
* Results appear in real-time below the editor with streaming support for large datasets
* Performance metrics including execution time, rows affected, and resource usage
* Memory-efficient result handling for queries returning millions of rows
## 2. Results and Logs Panel
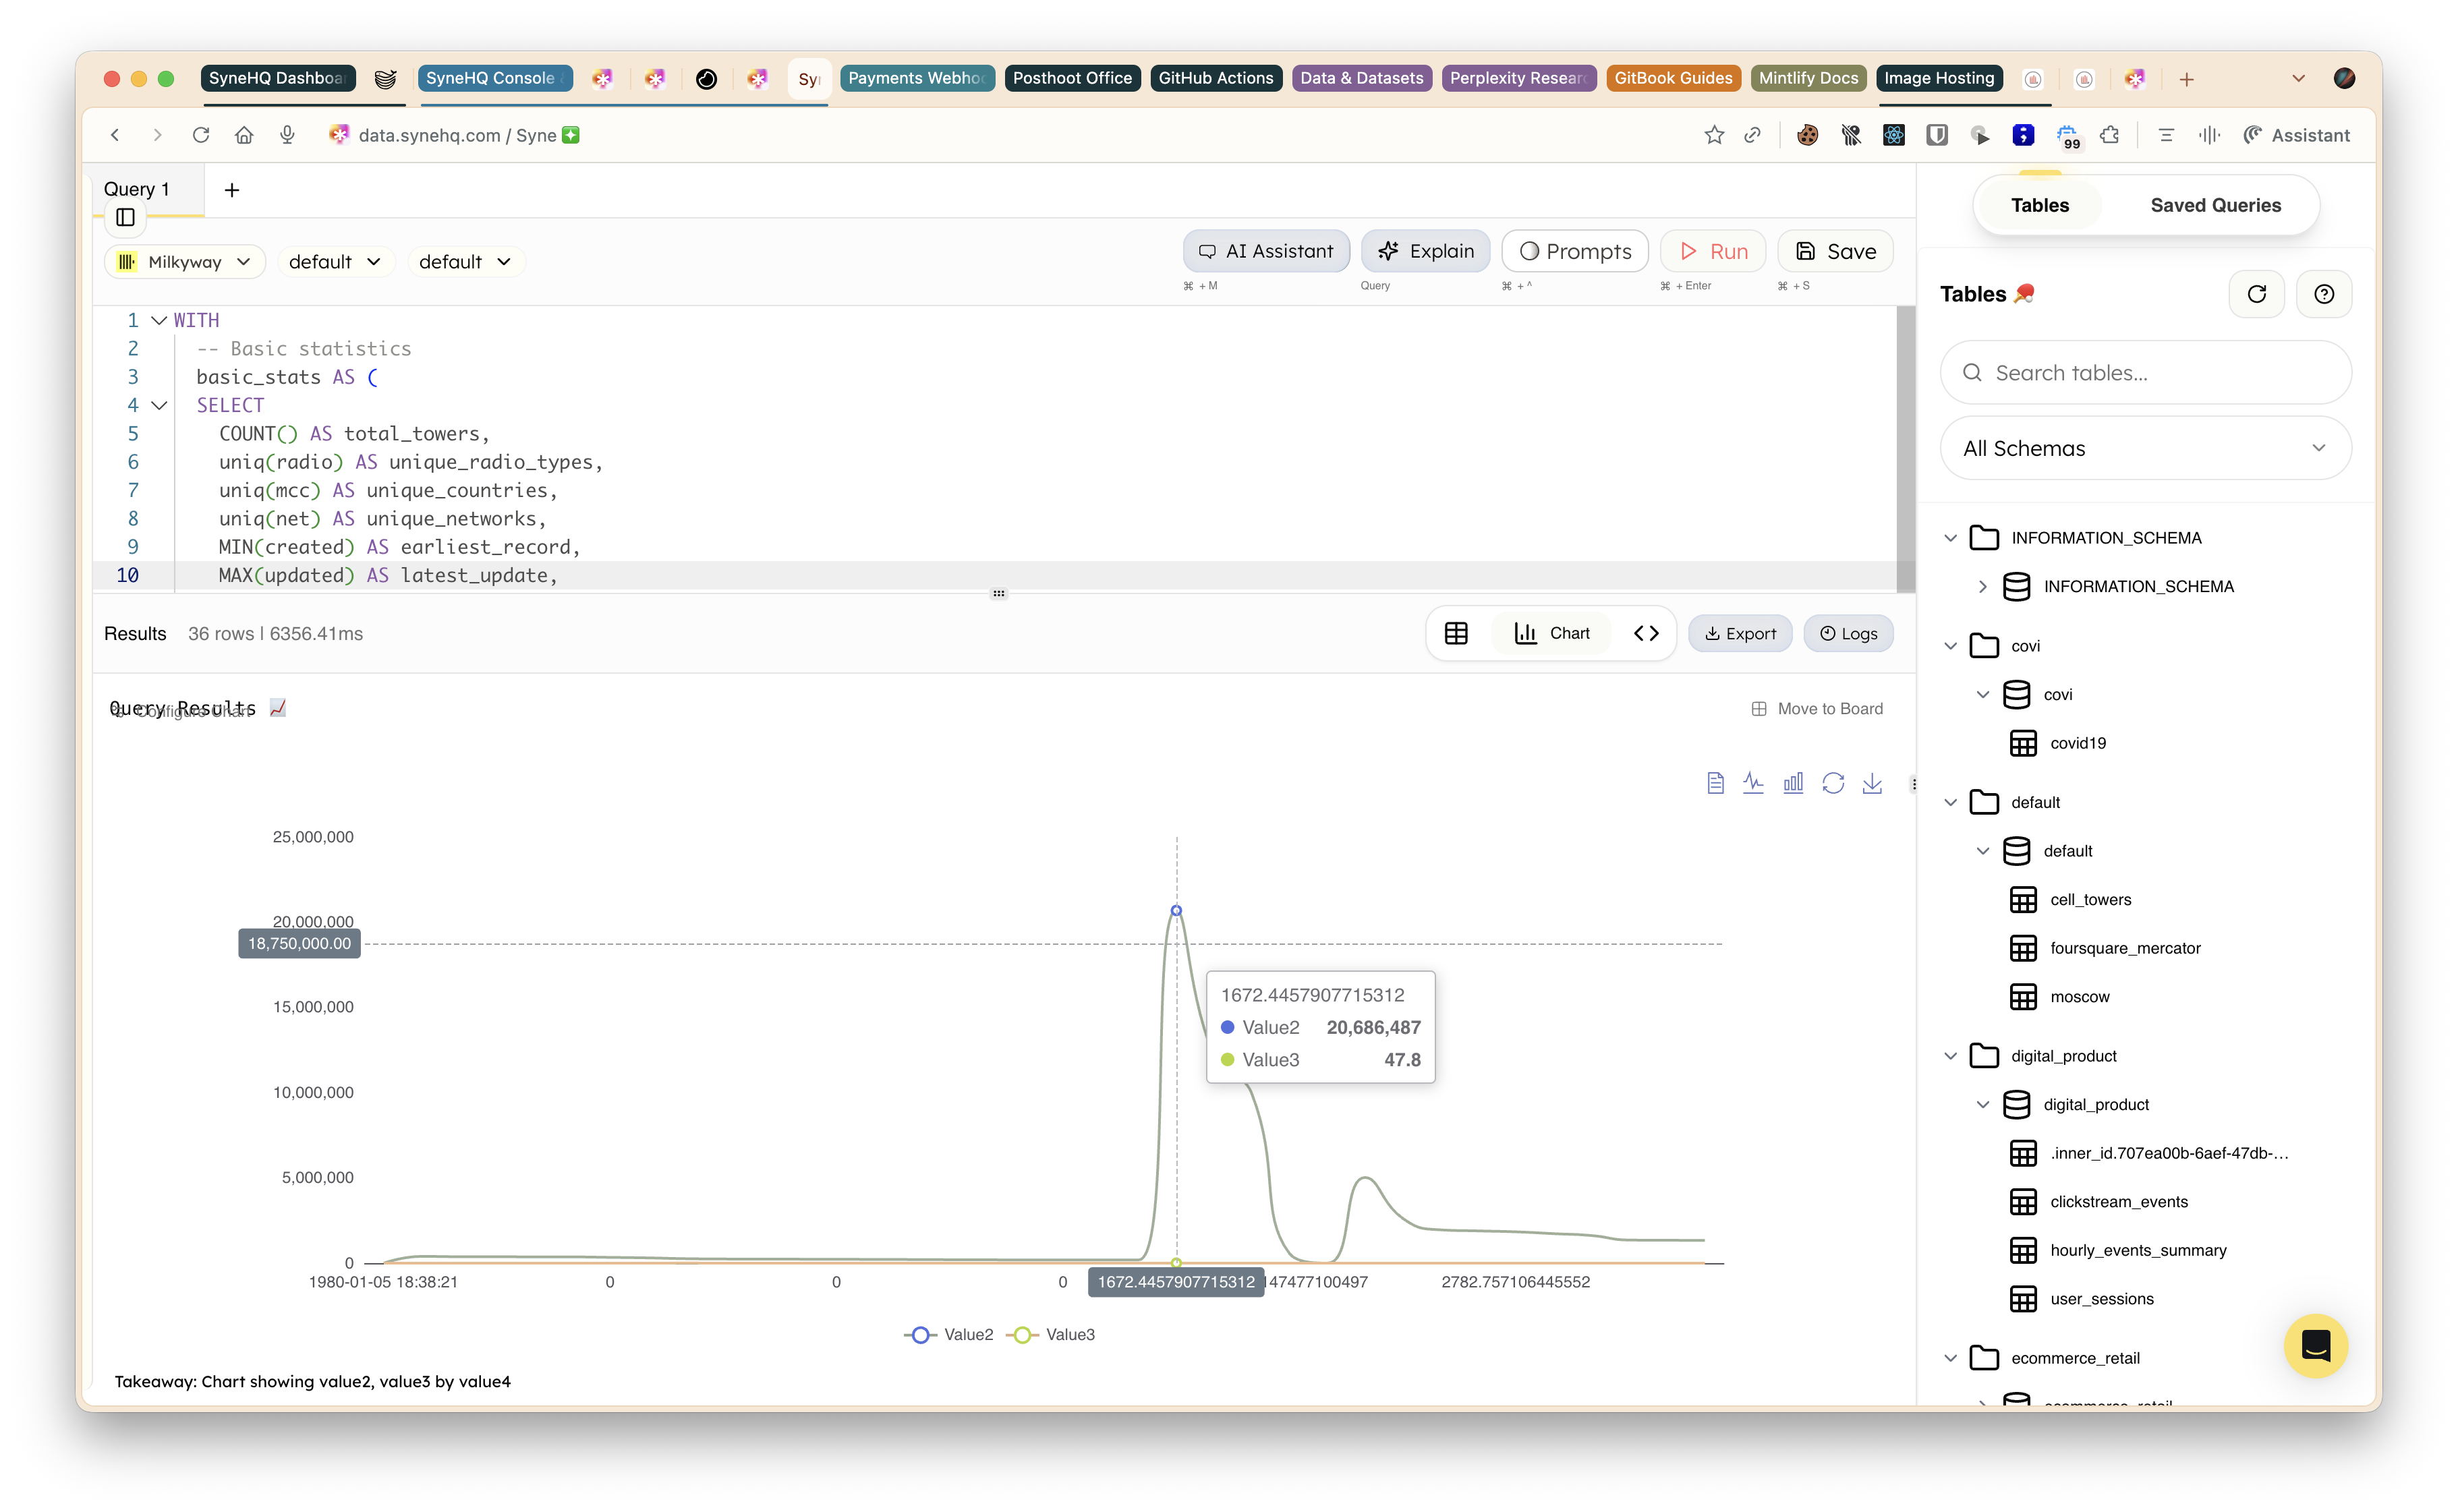
* **Grid/Table View**
* Default results shown in a grid with options to switch to JSON/Kanban.
* Pagination and row count for large result sets (e.g., 43.3M rows with 50/page).
* **Visualization**
* Results can be visualized in form of beautiful charts
* Automatic chart type selection based on data structure
* Support for bar charts, line graphs, pie charts, and scatter plots
* Interactive charts with hover details and drill-down capabilities
* Export visualizations as PNG or PDF for reports and presentations
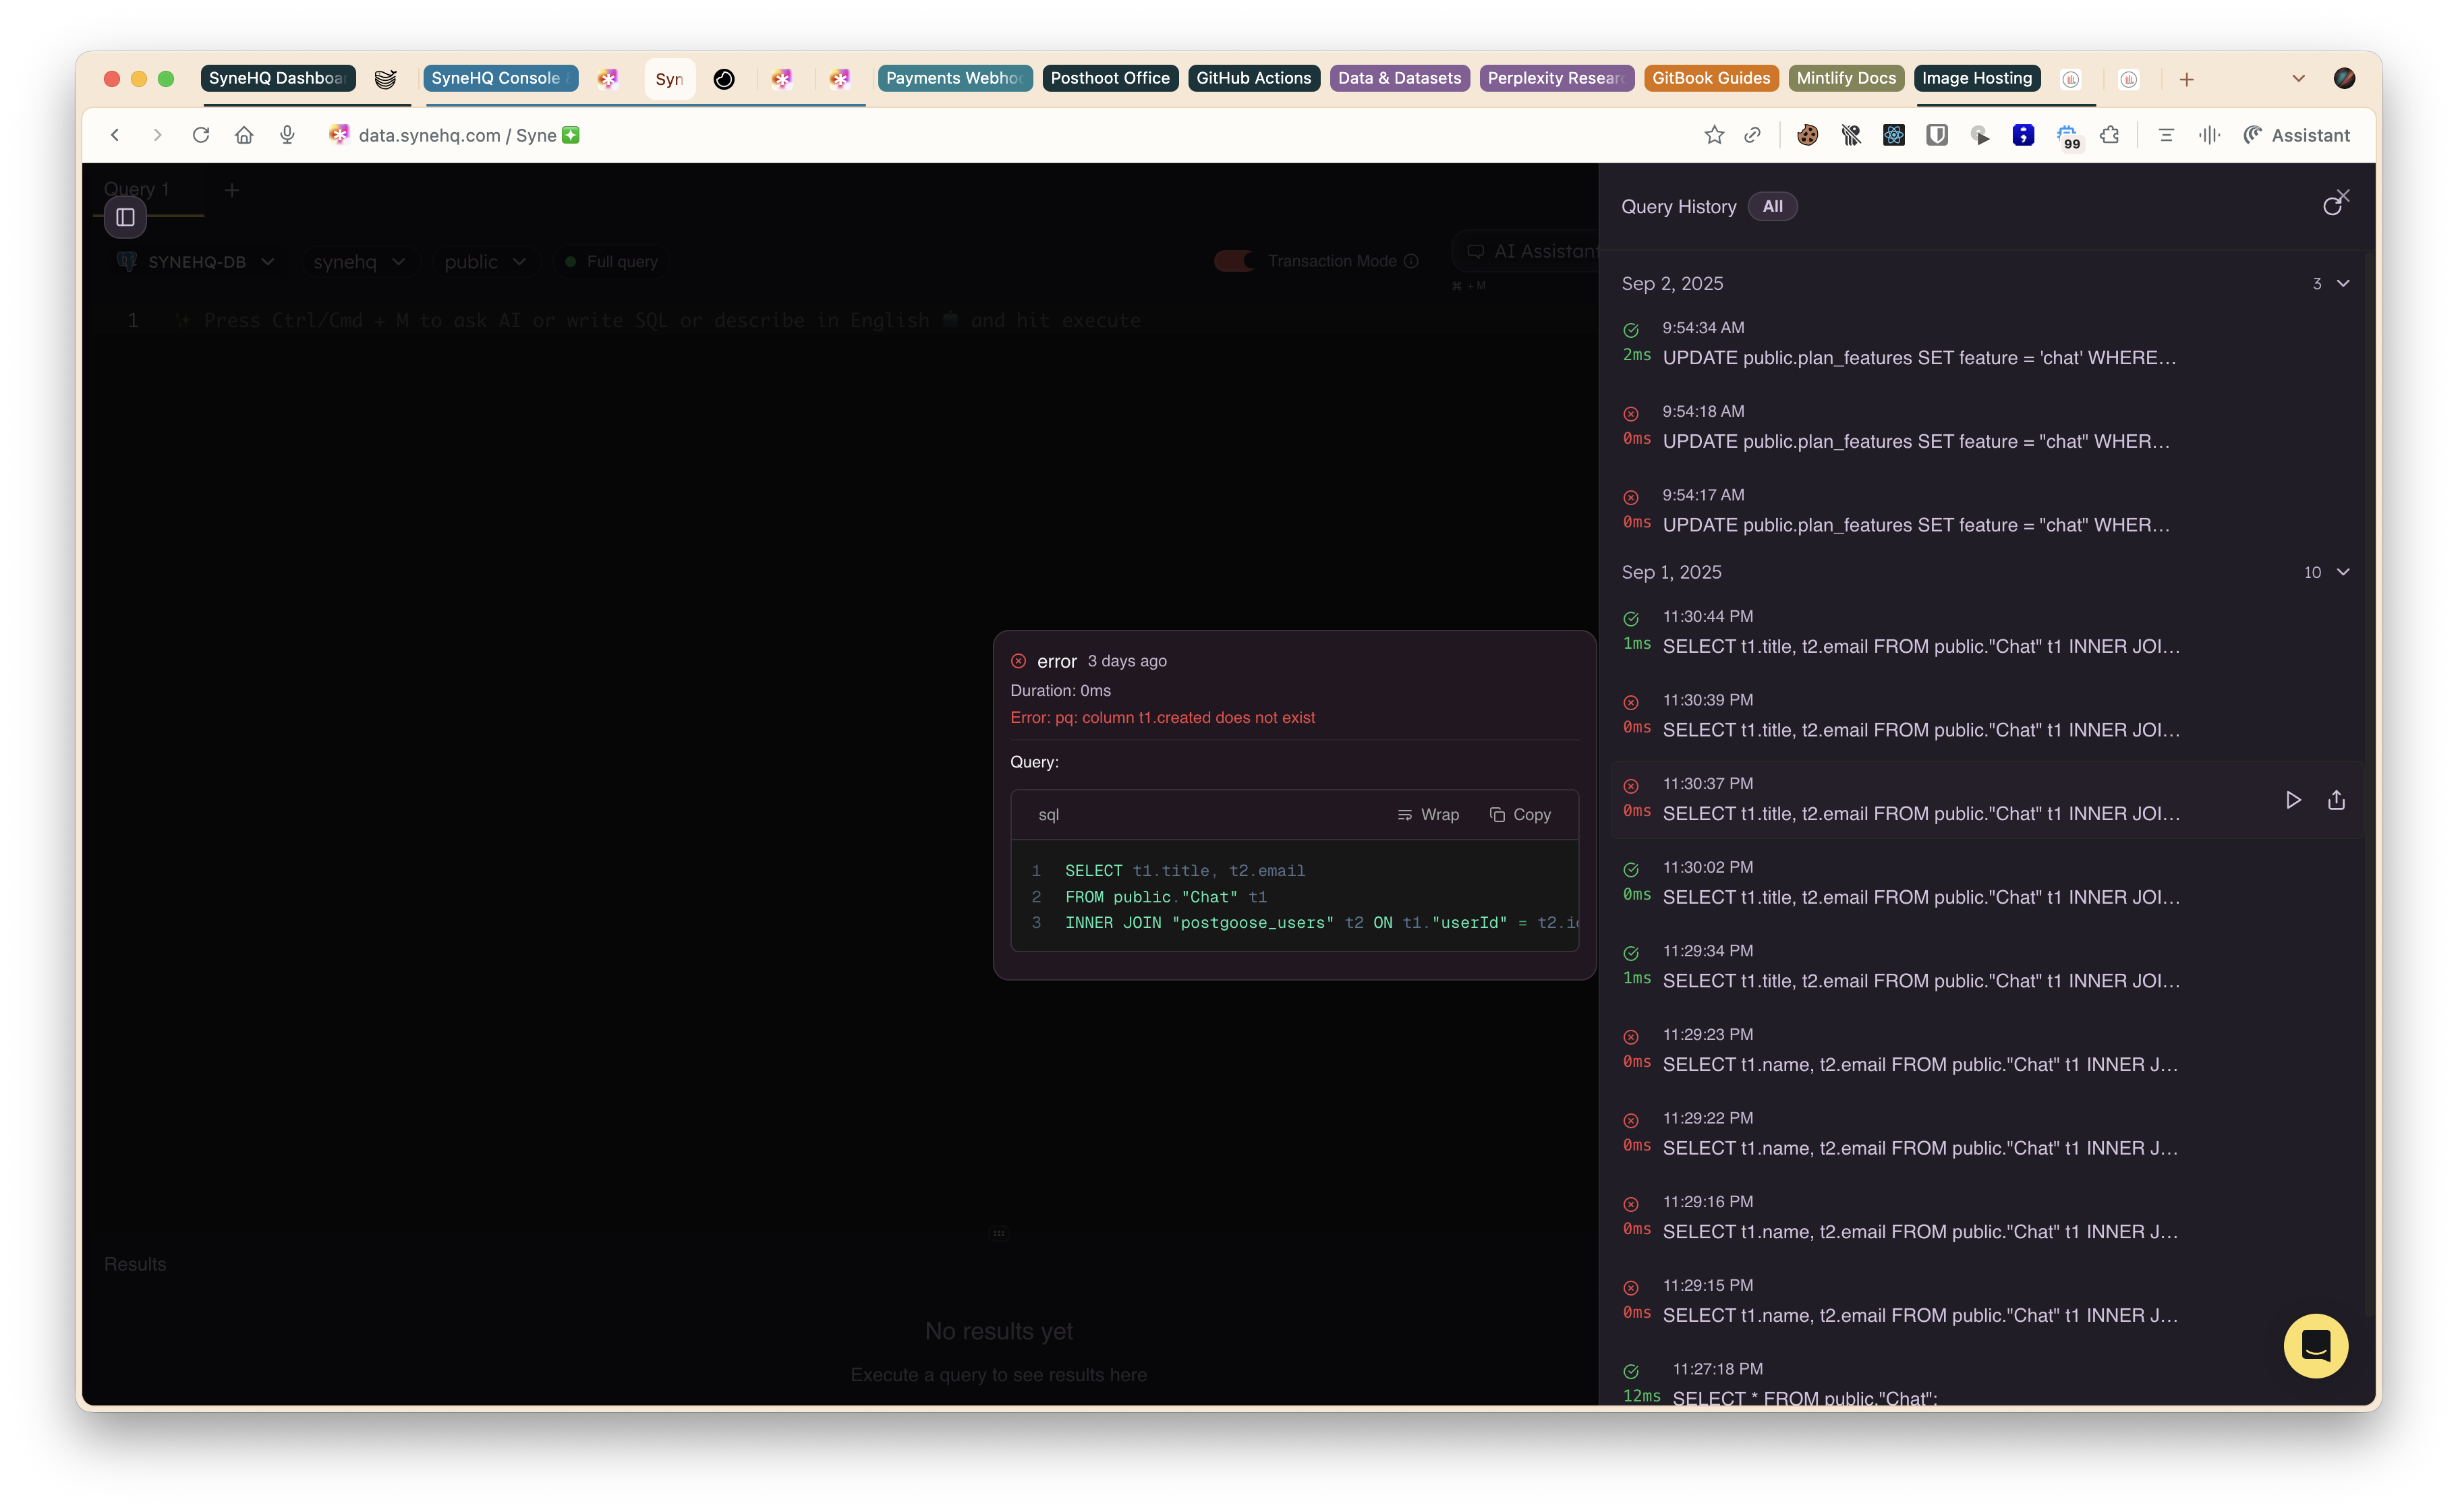
* **Logs/Errors**
* Log panel shows backend response time, errors, and detailed traces.
* Errors and warnings shown inline where queries fail.
## 3. AI Assistant & Prompt Features
* **Explain Query**
* “Explain” button or prompt generates human-readable explanations for any SQL run.
* Includes query breakdown, optimization tips, performance warnings, and sample row output.
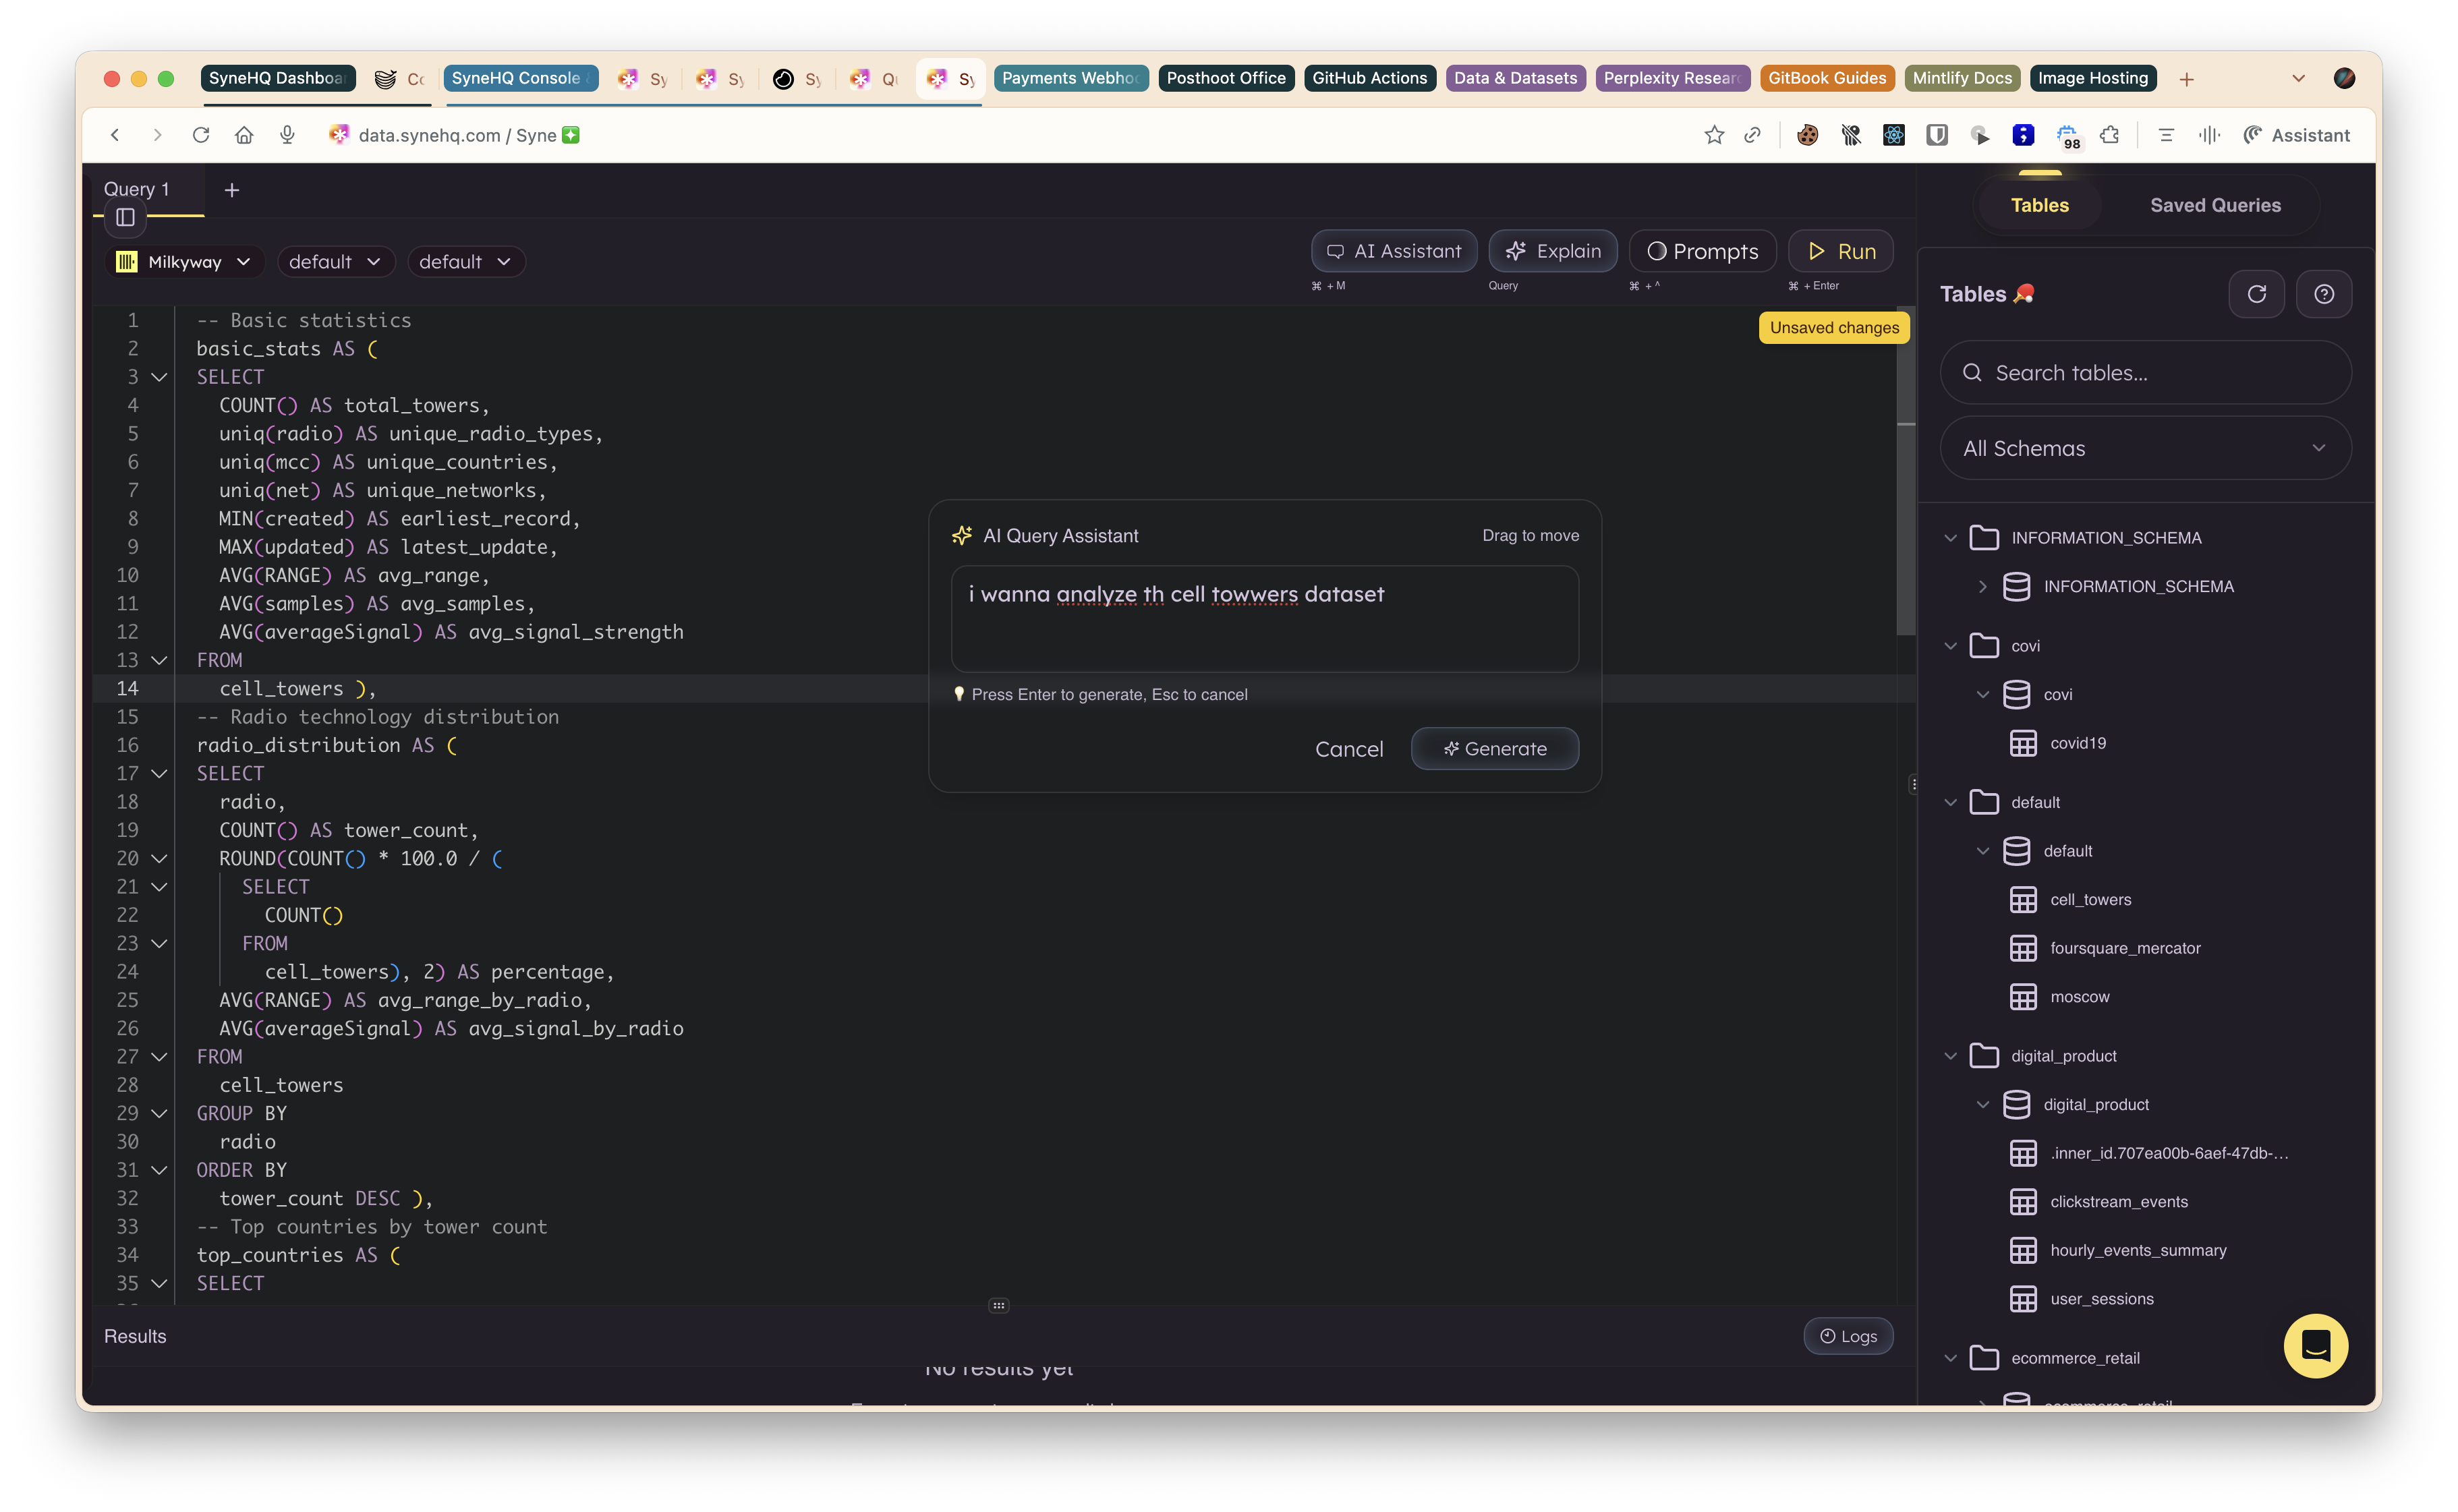
* **Natural Language to SQL**
* Describe your need in plain English; the system converts it to SQL.
* Prompts like “Which product has the highest profit margin?” trigger auto-generated queries.
* **Prompts & Suggestions**
* Built-in suggested prompts are available for quick starts.
* Easy toggling between typing SQL or English.
## 4. Saved Queries & History
> shortcut: ⌘ + S
After successfully executing your queries, you can take advantage of the query console's feature to save your queries. This allows you to efficiently manage your work by keeping a record of your queries for future reference. Additionally, you can easily share these saved queries with your team members, facilitating better collaboration and ensuring everyone has access to the necessary data.
* Save, name, and describe any query for future use.
* Saved queries are accessible in a dedicated tab and can be instantly re-run or edited.
![]() * **Query History**
* Each console session tracks recent queries for easy browsing and recall.
> Collapsible table/database schema explorer.
## 5. Error Handling & Logging
* Errors and logs appear inline in the results/logs area for rapid troubleshooting.
* AI provides explanations and tips for common SQL issues.
# Data Explorer
Source: https://docs.synehq.com/features/data-explorer
Interactive schema browsing and table exploration
SyneHQ's Data Explorer provides an intuitive interface for browsing database schemas, exploring table structures, and understanding your data relationships. Navigate through your database with ease using our interactive sidebar and detailed metadata views.

## Schema and Table Explorer
### Sidebar Table Browser
* **Hierarchical Schema View**
* Lists all schemas and databases in an organized tree structure
* Expandable schema nodes show contained tables (e.g., `default`, `digital_product`, `ecommerce_retail`)
* Visual indicators for different object types (schemas, tables, views)
* Collapsible sidebar for maximum workspace utilization
* **Interactive Table Navigation**
* Tables are expandable to reveal column details and data types
* Click on table names to insert them directly into the query editor
* Column names can be clicked to add them to your current query
* Drag-and-drop functionality for building queries visually
* **Smart Search and Filtering**
* Real-time search to quickly locate specific tables or columns
* Filter by schema, table type, or data type
* Search across table names, column names, and descriptions
* Recently accessed tables appear at the top for quick access
### Table Metadata and Details
* **Comprehensive Schema Information**
* View complete table schema including column names, data types, and constraints
* Primary key and foreign key relationships clearly displayed
* Null/not-null constraints and default values shown
* Index information and performance optimization hints

* **Data Preview and Sampling**
* Instant preview of table data without writing queries
* Sample rows displayed to understand data structure and content
* Data type validation and format examples
* Row count and table size statistics
* **Relationship Mapping**
* Visual representation of foreign key relationships
* Connected tables highlighted for easy navigation
* Relationship cardinality (one-to-one, one-to-many, many-to-many)
* Suggested join paths for complex queries
## Advanced Exploration Features - Console tab
### Column Analysis
* **Data Distribution**
* Unique value counts and null percentages
* Min/max values for numeric columns
* Most frequent values for categorical data
* Data quality indicators and anomaly detection
* **Type Intelligence**
* Automatic data type detection and suggestions
* Format patterns for dates, phone numbers, emails
* Encoding detection for text fields
* Numerical precision and scale information
### Query Building Assistance
* **Visual Query Builder**
* Drag tables to create automatic join suggestions
* Point-and-click column selection
* Visual relationship mapping for complex joins
* Query optimization recommendations
* **Template Generation**
* Common query patterns for each table
* Sample SELECT, INSERT, UPDATE, DELETE statements
* Aggregation templates based on column types
* Best practice query structures
# Compile and govern a dbt project
Source: https://docs.synehq.com/features/dbt/compilation
Inspect a GitHub-backed dbt project in an isolated compiler and carry its source revision into reviewed schema changes.
Connect GitHub when you want to compile source on request and review changes alongside their model context. Repository ownership, source editing, pull requests, production builds, and schedules stay in your existing tools.
## Connect source
As a team admin, open **Database tools > dbt > Connect project** and choose **GitHub**. Select an existing Syne PostgreSQL connection, then choose **Connected team GitHub App**. This reuses the installation and repository inventory from Syne's GitHub integration; no second App or personal token is required.
1. Use **Connect or manage GitHub** to open the existing installation flow. A GitHub account or organization owner links the installation to your team and selects repositories in GitHub.
2. Return to dbt and choose **Refresh list**. Use **Sync GitHub access** after changing the repositories granted to the App. Search and page through the connected repositories, then select one. Suspended installations cannot be selected.
3. The branch field starts with the repository's default branch. Set the ref, project folder, and target schema, then connect. Syne resolves the selected ref to an immutable commit before compilation.
For public repositories or a personal read token, choose the alternate access mode. Existing projects can switch to App access in **Settings > Source access**; saving removes the old stored personal token and requires a new artifact for the updated project revision. Legacy dbt-specific App installations must be linked through the shared team GitHub integration before they can be used.
The shared App token is short-lived and restricted to the selected repository with Contents and Metadata read permissions. SQL pull-request review is a separate opt-in setting; a repository does not need reviews enabled to be available to dbt. Sync refreshes repository access, not source files or compiled artifacts. Compilation always reads the configured ref on request.
Disconnecting or suspending an installation, removing a repository, or syncing a repository rename invalidates affected project revisions and cancels their queued/running compilations. A team runner stops when its next heartbeat is rejected. Reconnect access, update project settings when needed, and request a new compilation. Existing artifact history remains available for inspection.
For small projects, use the Syne-hosted compiler. For more capacity, [register a team runner](/features/dbt/team-runners), then select it in project settings. A team runner needs its own local GitHub read credential and repository allowlist; Syne still needs source access to resolve the commit.
## Choose capacity
| Target | Resources | dbt process time | Source bounds |
| ----------------------------- | ------------------------------------------- | ---------------------------------------------------------- | ------------------------------------------------------- |
| Syne-hosted legacy controller | 1 CPU, 512 MB | Up to 220 seconds (3 minutes 40 seconds) | Small projects; see validation errors for source limits |
| Shared Syne pool | Default 2 CPU, 4 GB | Default 15 minutes; operator-configurable up to 30 minutes | 300 selected files and 3 MB source |
| Team-managed | Default 2 CPU, 4 GB; up to 16 CPU and 16 GB | Default 15 minutes; configurable 60 seconds–30 minutes | Up to 5,000 source files and 32 MB decoded source |
| Import an artifact | Your existing environment | Your environment's limit | Manifest up to 32 MB and 10,000 normalized resources |
The time limit is a maximum, not a waiting period. A hosted compilation returns as soon as it finishes. With the legacy controller, at 220 seconds an unfinished dbt process is stopped; the controller has a 260-second execution budget before forced container removal is attempted. Fetching source, startup, transfer, and cleanup add time around the dbt process. The overall time shown to a user can therefore be longer than 3 minutes 40 seconds.
A timeout produces a failed compilation with no deployment or warehouse write. Retry explicitly, choose a larger team runner, or import an artifact compiled in your existing environment. The operator guide describes cleanup behavior when the Docker daemon itself fails.
## Inspect the result
Choose **Compile on Syne** or **Queue compilation**. Inspect generated SQL, declared columns, dependencies, and the recorded commit. History shows resources added, removed, or changed since the previous successful snapshot. You can preview an existing relation or a compiled SELECT through Syne's read-only database bridge, with up to 100 rows.
The pinned compiler uses dbt Core 1.10.15 for offline PostgreSQL compilation. It has no warehouse credentials or network. Vendor packages in the repository. Warehouse introspection, package installation, Python models, custom adapters, `dbt run`, and `dbt build` are unsupported. Use an imported manifest when the existing environment must perform compilation. GitHub-mode imports require a source SHA validated against the repository; the artifact remains labeled as supplied by your team.
## Review a schema change
Select a model and propose a change ticket with explicit migration SQL, a reason, and optional rollback SQL. Syne attaches the model, compilation, and source commit to its existing review workflow. A compiled SELECT is not automatically converted into migration SQL. Ticket creation does not execute the migration or open a GitHub pull request.
Kole can explain dependencies, draft documentation and tests, or propose migration SQL. Its compilation and ticket tools pause for human approval. Review the SQL and source revision before approving the next action.
Changing project settings invalidates older jobs and artifacts for execution. Successful compilation shows that an artifact was produced; it does not certify query execution, data tests, materialization, or freshness.
## Shared Syne runner pool
When your deployment enables a shared pool, selecting the Syne-hosted runner queues compilation durably. Available workers serve multiple teams, with one active pool job per team. Each job receives a new isolated compiler container. Queued and running jobs can be canceled; expired leases fail visibly and require an explicit retry. The legacy hosted controller remains available when a pool is not configured.
# Analyze existing dbt models
Source: https://docs.synehq.com/features/dbt/connect-existing-models
Query models built in dbt Cloud or another dbt environment without connecting GitHub or running a Syne compiler.
Start here when your team already builds dbt models elsewhere and wants to analyze their data in Syne. A team admin creates the connection. Team members with access can inspect metadata and run governed queries.
## Before you connect
* Add the PostgreSQL warehouse containing the built tables or views to your Syne team. Select the database that matches the manifest.
* Ensure the model relations exist and the connection has permission to read them.
* Use a PostgreSQL manifest with schema version 9–12, no more than 32 MB, and at most 10,000 normalized resources. Custom adapters and other warehouses are outside this preview.
## Connect dbt Cloud
1. Open **Database tools > dbt > Connect project** and choose **dbt Cloud**.
2. Enter a project name and choose the existing PostgreSQL warehouse connection.
3. Enter the dbt Cloud account hostname, account ID, and job ID. Use the hostname from your account URL, such as `your-account.us1.dbt.com`, without `https://` or a path. Documented regional account hosts and supported legacy hosts are accepted.
4. Supply a dbt Cloud token with permission to read the selected job, runs, and run artifacts. Prefer a service token with the minimum permissions your dbt Cloud plan supports. Syne stores it encrypted and does not return it in project responses.
5. Connect. Syne verifies the account and job, then requests the latest successful run's `manifest.json`. If initial refresh fails, the project stays connected so you can fix access and retry **Refresh metadata**.
Syne uses only GET requests to dbt Cloud: job lookup, successful-run lookup, and manifest retrieval pinned to that run ID. It does not trigger jobs, change schedules, or connect to your repository. The artifact is taken from the run's last step. Choose a job whose final step provides the model metadata you need.
The workspace records the provider run ID and available source SHA. Use **Settings** to renew the read token. Refresh metadata after saving settings. Metadata is not continuously synchronized.
## Import from another dbt environment
1. Generate or obtain `target/manifest.json` from your existing dbt build or compilation environment. Keep warehouse credentials and `profiles.yml` outside the artifact upload.
2. Choose **Import manifest** in **Connect project**.
3. Enter a project name, choose the PostgreSQL warehouse, and select the manifest file.
4. Connect. The imported snapshot is labeled as supplied by your team. Import a newer manifest when definitions change.
No repository, GitHub token, commit SHA, dbt Cloud token, or runner is required for this mode. The file supplies model metadata; it does not transfer warehouse rows or build missing relations.
## Run an analysis
Select a model and open **Analyze data**. **Start with selected model** inserts a quoted relation query. Replace it with the analysis you need. For example, if your project contains `analytics.customer_revenue` with `customer_id` and `lifetime_revenue`:
```sql theme={"system"}
select
customer_id,
lifetime_revenue
from analytics.customer_revenue
order by lifetime_revenue desc
```
These names are illustrative. Use the schema, relation, and columns shown in your own project. Queries return at most 200 rows in the editor. Aggregations run in the warehouse; the row cap limits returned rows, not the amount scanned.
Ask Kole: “Use the current dbt metadata to show the customers with the highest lifetime revenue. Show the SQL and explain what this model measures.” Read-only queries can run automatically. Check definitions and artifact provenance before treating the answer as a business metric.
## Troubleshooting
| Symptom | Next step |
| --------------------------- | ----------------------------------------------------------------------------------------------------- |
| No successful dbt Cloud run | Build the intended job in dbt Cloud, then refresh metadata in Syne |
| Access denied | Check hostname, account, job, and token permissions; renew the token in project settings |
| Refresh failed | Inspect metadata history, fix the provider error, and retry; the last successful snapshot is retained |
| Relation not found | Confirm the selected database and schema; build the model in the existing dbt environment |
| Project changed | Refresh or import metadata for the current project settings |
| Unsupported manifest | Use a compatible PostgreSQL artifact within the version and size bounds above |
Analysis-only projects do not offer compilation, compiled-SELECT previews, or schema-change ticket creation. Connect a separate [GitHub project](/features/dbt/compilation) when you need that workflow.
# dbt in Syne
Source: https://docs.synehq.com/features/dbt/overview
Connect existing dbt models for analysis, or connect a GitHub project for isolated compilation and reviewed changes.
dbt projects, including dbt Cloud analysis, manifest imports, GitHub compilation, and team-managed runners, require Syne Pro or an eligible trial.
Syne brings dbt model definitions, dependencies, SQL analysis, and change review into one workspace. Your existing dbt environment continues to build and schedule the models.
This integration is a PostgreSQL preview. Your Syne deployment must include the matching dbt app and metadata migrations. Snowflake, BigQuery, and Redshift are outside this preview.
## Choose how to connect
| Starting point | What to connect | What you can do |
| ------------------------------------- | ---------------------------------------------------------------------------------- | --------------------------------------------------------------------------------------------------------- |
| Models built by dbt Cloud | Read token, account, job, and an existing Syne PostgreSQL connection | Refresh model metadata, browse definitions and dependencies, query built relations, and analyze with Kole |
| Models built elsewhere | `manifest.json` and an existing Syne PostgreSQL connection | Import model metadata and analyze built relations without GitHub or a dbt platform token |
| Source you want to compile and govern | GitHub repository, ref, project folder, and an existing Syne PostgreSQL connection | Compile on request, inspect SQL and changes, query data, and create reviewed schema-change tickets |
dbt Cloud does not serve the model rows to Syne. Models materialize as tables or views in your warehouse, and queries use your existing Syne connection. Syne retains model metadata and artifact history, not a hosted copy of the warehouse.
Start with dbt Cloud or a manifest. GitHub and compilation are optional.
Connect GitHub, inspect generated SQL, and propose reviewed changes.
Use your own Linux machine for larger compilation jobs.
## Query with model context
Open **Database tools > dbt**, choose a project, and select a model. Inspect its declared columns, descriptions, upstream dependencies, and artifact provenance. **Analyze data** accepts read-only SQL for joins and aggregations on built relations. The editor displays up to 200 rows; the API permits up to 1,000. Single-model previews show up to 100 rows.
Queries run through Syne's database bridge under the requesting user's identity, with read-only enforcement, team scoping, masking, and auditing. Use the correct warehouse database and least-privilege connection; importing metadata does not grant access to a relation.
Kole can explain the model, help write an aggregate, and execute read-only dbt analysis through the same app APIs. Compilation and schema-change ticket creation pause for human approval. Analysis-only projects do not expose these source-management actions.
## Know what the artifact proves
An artifact records model definitions at a point in time. A successful compilation does not build a table, execute data tests, or prove freshness. A successful dbt Cloud run identifies the artifact's origin; Syne does not import test results or certify that every model was built by that run. Querying requires the selected relation to exist in the connected database.
Metadata refresh and manifest import are manual. A failed refresh keeps the previous successful snapshot. After project settings change, refresh or import current metadata before querying. Each project permits one active metadata request; compilation, refresh, and import share a limit of 20 requests per team per hour.
Syne deployments may provide a shared managed runner pool. Multiple worker replicas serve team-isolated compilation jobs from a durable queue and create a fresh compiler container per job. Teams keep their existing project connection; they do not register these shared workers.
# Install a team-managed dbt runner
Source: https://docs.synehq.com/features/dbt/team-runners
Connect a dedicated Linux machine to Syne for isolated dbt compilation with more time and capacity.
A team runner is a dedicated Linux machine that polls Syne for compilation jobs over outbound HTTPS. Teams own the machine, its capacity, and its GitHub read credential. Syne owns the project connection, job queue, source commit, artifact history, and review workflow. GitHub remains the source of truth.
Team-managed runners and all dbt project connection modes require Syne Pro or an eligible trial.
## Analyze an existing dbt project without a runner
If your models are already built in dbt Cloud or another platform, connect dbt Cloud metadata or import `manifest.json` in Syne. Neither analysis mode needs GitHub access or a runner. Syne reads the model definitions and queries the existing tables or views through your connected PostgreSQL warehouse. dbt Cloud supplies metadata, not model rows. Metadata refresh does not trigger a dbt job or certify data freshness. See [connect existing models](https://docs.synehq.com/features/dbt/connect-existing-models).
Use the installation below when a GitHub-backed project needs compilation on your own compute. The current integration is a PostgreSQL preview; support depends on the matching Syne app deployment.
## Shared Syne-managed capacity
SyneHQ can run a shared worker pool across teams from the main DevOps `docker/docker-compose.yml`. Pool workers automatically provision an isolated compiler container per leased job. They use an operator token and never register as a team runner. Teams choose the Syne-hosted runner in project settings; the app queues work across eligible teams with one active pool job per team and a global capacity cap.
See [shared pool deployment](https://github.com/SyneHQ/devops/blob/sudo/guides/dbt-pool.md). This requires the updated app and the runner image containing `pool_agent.py`. Capacity is set through worker replicas; VM provisioning and queue-driven autoscaling are not included.
## Choose a compilation target
| Target | Resources | dbt time limit | Suitable for |
| ----------------------------- | -------------------------------------------------------- | -------------------------------------------------------------- | ------------------------------------------------------------ |
| Syne-hosted legacy controller | 1 CPU, 512 MB | 3 minutes 40 seconds | Small PostgreSQL projects |
| Shared Syne pool | Default 2 CPU, 4 GB | Default 15 minutes; operator-configurable up to 30 minutes | Shared capacity across teams; hosted source limits apply |
| Team-managed | Default 2 CPU, 4 GB; configurable up to 16 CPU and 16 GB | Default 15 minutes; configurable from 60 seconds to 30 minutes | Larger projects on a team's own compute |
| Imported manifest | Your existing dbt environment | Determined by that environment | Warehouse introspection, custom adapters, or existing builds |
Each registered runner executes one job at a time. Register separate identities on separate machines to run projects concurrently. One project can have one active metadata request; compilation, metadata refresh, and manifest import share a team quota of 20 requests per hour. Team-owned runners remain dedicated to a single team. Shared capacity uses the managed pool described above. Queue-driven autoscaling, production builds, scheduling, metered compute billing, and automatic failover are not included.
## Install
1. Provision a dedicated Linux amd64 host with Docker and gVisor `runsc`. Give it enough RAM and disk for the chosen sandbox limits plus the agent and operating system. Do not share its Docker daemon with databases or unrelated workloads. Docker socket access controls the host even when the socket mount is read-only.
2. In Syne, open **Database tools > dbt > Team-managed runners > Register runner** as a team admin. Save the one-time credential in your machine's secret manager. Syne stores only its SHA-256 hash. Each credential belongs to one team.
3. Grant the host read access to the private GHCR packages. Pre-pull a reviewed compiler image and matching runner image. Registry credentials stay in the host's deployment tooling; they are not mounted in the agent or sandbox. The repository and images are currently private: Syne must grant package access before customer onboarding.
4. Deploy `ghcr.io/synehq/syne-dbt-runner:sudo` using [the team runner Compose file](/downloads/dbt-runner/docker-compose.yml). Pin both image digests for production. The agent has no listening port; it needs outbound access to the Syne app origin, `api.github.com`, and `codeload.github.com`.
5. Set the variables below through the host's secret manager, start the agent, and confirm **Online** in Syne. If your team enforces an IP allowlist, add the machine's trusted egress address through the existing team policy.
6. Open the connected project's **Settings**, select the runner, save, and choose **Queue compilation**. Project configuration changes invalidate older jobs and artifacts. The app uses the team’s shared GitHub App installation (or a personal read token) to resolve the selected ref to an immutable commit; the runner separately needs local access to download that commit. Syne never sends its installation token to the runner.
| Variable | Required / default |
| -------------------------- | -------------------------------------------------------------------------------------------------------- |
| `SYNE_DBT_APP_URL` | Required; Syne's HTTPS origin, without a path, query, or credentials |
| `SYNE_DBT_RUNNER_TOKEN` | Required; one-time credential from your team's registration dialog |
| `SYNE_DBT_REPOSITORIES` | Required; comma-separated `owner/repository` allowlist for this machine |
| `SYNE_DBT_GITHUB_TOKEN` | Local GitHub token with Contents read for allowed private repositories; optional for public repositories |
| `SYNE_DBT_TIMEOUT_SECONDS` | `900`; allowed range `60–1800` |
| `SYNE_DBT_MEMORY_MB` | `4096`; allowed range `512–16384` |
| `SYNE_DBT_CPUS` | `2`; allowed range `1–16` |
| `DBT_SANDBOX_IMAGE` | Matching pre-pulled compiler image; pin a digest |
| `DBT_DOCKER_GID` | Group ID of the dedicated Docker socket, used by Compose |
| `DBT_DOCKER_SOCKET_PATH` | Path of the dedicated Docker socket, used by Compose |
| `SYNE_DBT_RUNNER_IMAGE` | Agent image, used by Compose; pin a digest |
### Start the agent
Download the Compose file linked above as `docker-compose.yml` on the dedicated host. Register `runsc` with that Docker daemon using the [gVisor installation instructions](https://gvisor.dev/docs/user_guide/install/). Confirm `runsc` appears in `docker info --format '{{json .Runtimes}}'` before proceeding.
Inject the required variables from the table through your secret manager. This non-secret example sets the capacity and pins the matching images published for the preview; supply the app origin, runner credential, repository allowlist, local GitHub token, and socket configuration separately:
```sh theme={"system"}
export SYNE_DBT_RUNNER_IMAGE=ghcr.io/synehq/syne-dbt-runner@sha256:a9717f647d22e255e7717b485fd57c63af895a51c07ab852828f11d74ae080c0
export DBT_SANDBOX_IMAGE=ghcr.io/synehq/syne-dbt-compiler@sha256:d8a5326582e1de2f9313b635d4a31732b31924a10ecb0f388b042e7cd0ee71e4
export SYNE_DBT_TIMEOUT_SECONDS=900
export SYNE_DBT_MEMORY_MB=4096
export SYNE_DBT_CPUS=2
docker login ghcr.io
docker pull "$DBT_SANDBOX_IMAGE"
docker compose -f docker-compose.yml up -d
docker compose -f docker-compose.yml ps
docker compose -f docker-compose.yml logs --tail=50 dbt-runner
```
Registry authentication needs package read access. Use `docker login` interactively or your deployment system's secret input, never a credential embedded in a command. Pull the compiler into the same daemon selected by `DBT_DOCKER_SOCKET_PATH`; set `DOCKER_HOST` appropriately in your deployment shell if it is not the default daemon. The Compose agent's internal `DOCKER_HOST` is already configured for its mounted socket.
Confirm **Online** in Syne before selecting the runner in project settings. If it stays offline, check outbound HTTPS, the app origin, the runner credential, the team's IP policy, and Docker socket permissions. If jobs fail before compilation, check GitHub Contents read access, the allowlist, the pre-pulled compiler image, and `runsc` registration. Stop the agent with `docker compose -f docker-compose.yml down`; pause new jobs in Syne first if you want a running job to finish.
The local GitHub token is never sent to Syne. Syne does not send its stored repository or database credentials to the runner. Only the source archive, target database/schema names, and numeric resource limits enter the compiler container. The agent's own environment contains credentials; operate it as a trusted host component. The compiler has no network, host mounts, credentials, capabilities, or writable root filesystem.
## Job lifecycle and controls
Syne pins the GitHub SHA before queueing. The runner checks its repository allowlist, downloads only that pinned archive, and advertises its locally configured capacity. A poll atomically claims one job with a fresh random lease. Heartbeats run every 20 seconds; a lease expires after 90 seconds. A failed heartbeat stops source retrieval or compilation. A job's absolute deadline is the advertised dbt timeout plus four minutes for source retrieval, startup, cleanup, and transfer.
Queued jobs expire after one hour. Expired jobs become failed when the queue or project is next inspected; they cannot be claimed or completed after expiry. Interrupted or failed jobs are never automatically retried or rerouted. Users request another compilation explicitly.
* **Pause new jobs** preserves the queue and lets the current job finish.
* **Cancel compilation** marks the job canceled immediately. The connected agent stops at its next heartbeat, normally within 20 seconds plus network latency. Syne rejects any subsequent result for that job.
* **Rotate credential** cancels queued/running jobs and invalidates the old token. Install the newly displayed token and restart the agent.
* **Revoke** cancels queued/running jobs and soft-deletes the runner. Projects keep their selection visible as unavailable until an admin chooses a replacement.
* Removing the requester from the team, deleting its connection, or changing project settings prevents the old job from submitting results. Disconnecting or suspending the shared GitHub App installation, removing repository access, or syncing a repository rename also invalidates the binding and cancels active jobs.
A timeout is a ceiling, not an artificial delay. The compiler process gets the configured duration; the host watchdog allows 40 additional seconds for startup/execution and then attempts forced removal, with a 15-second Docker cleanup limit and a bounded process wait. A broken Docker daemon still requires operator recovery. A failed compilation does not deploy models or write to the warehouse.
## Large-project bounds and compatibility
Team runners support up to 5,000 SQL/YAML/Markdown/CSV source files and 32 MB of decoded source, within a 64 MB encoded request. A downloaded archive is limited to 100 MB compressed, 256 MB expanded, and 20,000 entries. Source retrieval has a 120-second budget. Hidden files, profiles, logs, old targets, traversal paths, and selected symlinks are excluded or rejected. No archive is extracted onto the host.
The compiler manifest is capped at 32 MB and encoded result transport at 33 MB; Syne normalizes at most 10,000 resources. Sandbox limits include 256 processes and 512 MB temporary storage. Capacity is an upper bound; the machine must actually have those resources.
Compilation remains offline PostgreSQL dbt compilation with the pinned compiler version. Vendor packages in the repository. Warehouse introspection, dependency installation, Python models, custom adapters, `dbt run`, and `dbt build` are unsupported. Import a manifest from the existing environment when those are required. Model previews still use Syne's governed database bridge. A successful compilation is not proof of passing data tests or SQL execution.
Artifacts say **Compiled on team runner** and record its name. Team-controlled machines can alter their output; Syne does not attest that they executed an unmodified compiler. Reviewers should treat that provenance accordingly.
## Syne operator deployment
Apply the reviewed `20260911033525_dbt_team_runners` metadata migration after `20260910191632_dbt_governance`, generate Prisma, and deploy the matching app routes and UI. The durable queue lives in the metadata database and does not depend on a long-running app request.
The existing-model analysis modes additionally require `20260911041153_dbt_analysis_sources` and matching app and Kole versions. Apply reviewed migrations in order before enabling those routes. This guide's public copy and Compose download are generated in the docs repository with `npm run sync:dbt`; `npm run check:dbt-sync` detects drift against adjacent compiler and DevOps checkouts.
Allow these exact POST routes through browser-session/SSO middleware; each verifies its team runner bearer credential and team IP policy, and job routes additionally verify the lease:
* `/api/dbt/runner-agent/poll`
* `/api/dbt/runner-agent/jobs//heartbeat`
* `/api/dbt/runner-agent/jobs//complete`
Preserve the Authorization header and provide trusted client-IP headers from the edge. Do not exempt other dbt routes. Disable caching; allow at least 33,000,000 request-body bytes and a 60-second server budget on completion. A platform with a smaller fixed body limit requires a different artifact transport before large manifests are supported. The agent times out each HTTP request after 30 seconds and retries completion using the same lease; accepted completion is idempotent.
Keep the controller's shared secret separate from per-team runner credentials. Never enable `DBT_TRUSTED_LOCAL_TEST` or `SYNE_DBT_LOCAL_TEST` in deployment.
# Federated Analytics
Source: https://docs.synehq.com/features/federated-analytics
Query and join data across multiple databases without ETL
Federated Analytics in SyneHQ lets you run a single SQL query across multiple databases and file sources—no data movement required. It’s powered by Tangent Lake (DuckDB under the hood) and works with your existing connections.
## Why federated analytics?
* **One query, many sources**: Join Postgres, MySQL, SQLite, DuckDB files, even CSV/JSON
* **Zero ETL**: Analyze live data without pipelines
* **Faster iteration**: Explore, validate, and answer questions quickly
* **Governed access**: Uses SyneHQ connections, RBAC, and auditing
## Get started in minutes
Build a federated workspace using your existing connections
DuckDB ATTACH, planning, and orchestration explained
Copy‑paste queries for cross‑database joins and metrics
## Example: Postgres + MySQL
```sql theme={"system"}
SELECT u.id, u.name, SUM(o.amount) AS revenue
FROM postgres_db.public.users u
JOIN mysql_db.sales.orders o ON u.id = o.user_id
GROUP BY u.id, u.name
ORDER BY revenue DESC
LIMIT 10;
```
This runs live—DuckDB fetches only the data needed and performs the join. No exports or imports.
## Common patterns
```sql theme={"system"}
SELECT DATE_TRUNC('month', o.created_at) AS month, SUM(o.amount) AS revenue
FROM mysql_db.sales.orders o
GROUP BY month
ORDER BY month;
```
```sql theme={"system"}
SELECT u.email, c.last_login
FROM postgres_db.public.users u
JOIN read_csv_auto('https://example.com/logins.csv') c
ON u.email = c.email;
```
```sql theme={"system"}
CREATE TABLE top_customers AS
SELECT u.id, u.name, SUM(o.amount) AS revenue
FROM postgres_db.public.users u
JOIN mysql_db.sales.orders o ON u.id = o.user_id
GROUP BY u.id, u.name
ORDER BY revenue DESC
LIMIT 100;
```
## How it works (at a glance)
* **Tangent session**: Selected connections are attached into a DuckDB session
* **Federated planning**: Filters and projections are pushed down to sources
* **Minimal movement**: Only necessary data is pulled to complete the query
* **Extensible**: Supports Postgres, MySQL, SQLite, files (CSV/JSON/Parquet), and more
The federated query lake behind Federated Analytics
Query private/on‑prem data with a secure tunnel
## Tips
* Start with smaller result sets; expand once logic is correct
* Use explicit aliases for clarity across engines (e.g., `pg_`, `mysql_`)
* Materialize intermediate results only when needed (for repeat jobs)
* Monitor source credentials and permissions (least‑privilege recommended)
Federated Analytics is available in SaaS and enterprise self‑hosted. For large/regulated environments, contact us for sizing and rollout guidance.
# TCP TUNNEL
Source: https://docs.synehq.com/features/local-connections
Securely Connecting Local Hosted Datasources with SyneHQ Tunnel Client
Want SyneHQ to query data that lives only inside your network or on your laptop? Local Connections let you create a secure tunnel so your database stays private and SyneHQ can still reach it—no firewall surgery, no public exposure.
## What you'll do (2 minutes)
* Create a tunnel in SyneHQ to get a secure `token` and `port`
* Point your database connection in SyneHQ to `localhost:`
* Start the Rabbit Tunnel Client (CLI or Docker) to open the secure TCP tunnel
Create a tunnel to receive your token and port
Use localhost and your tunnel port for the host/port
## Step-by-step
* Go to the **Tcp Tunnel** page (sidebar) → **Tunnels**
* Click **Create Tunnel** to generate your **token** and **port**
* Copy both; you'll need them for the client
These credentials only allow access through the secure tunnel—your database itself stays private.
![Create Tunnel UI]() * Navigate to **Add Connection**
* Set the host to `localhost`
* Set the port to the value from your tunnel
* Enter DB credentials as usual
![Add Connection UI]() Using `localhost` makes your database appear local to SyneHQ—traffic still flows through the encrypted tunnel.
```
curl -fsSL https://github.com/SyneHQ/rabbit.go/blob/sudo/scripts/setup.sh | bash
```
```
wget -qO- https://github.com/SyneHQ/rabbit.go/blob/sudo/scripts/setup.sh | bash
```
```
export TUNNEL_TOKEN=your-token
docker run -d \
--network=host \
--name syne-rabbit-tunnel \
ghcr.io/synehq/rabbit-client:latest \
tunnel \
--server rabbit.synehq.com:9999 \
--local-port 5432 \
--token "$TUNNEL_TOKEN"
```
Only run install scripts or containers you trust. Review the script or image if your security policy requires it.
Now start the tunnel (replace placeholders). For the CLI binary:
```
rabbit.go tunnel --server rabbit.synehq.com:9999 --token YOUR_TOKEN --local-port 3000
```
* Use your actual `YOUR_TOKEN` or `TUNNEL_TOKEN` from step 1
* Set `--local-port` to your service's real port (e.g., 5432 for Postgres, 3306 for MySQL)
That's it—you can now query your private data from SyneHQ without exposing it to the internet.
## What the tunnel does (plain English)
* Creates an encrypted TCP channel from your machine/network to SyneHQ
* Keeps your database private—no inbound rules or public endpoints required
* Automatically reconnects with exponential backoff if the network blips
* Works great for dev and production with health checks and graceful shutdown
## Quick example: Local PostgreSQL
```
export TUNNEL_TOKEN=your-token
rabbit.go tunnel --server rabbit.synehq.com:9999 --token $TUNNEL_TOKEN --local-port 5432
```
SyneHQ can now talk to your local Postgres as if it were in the cloud—query, analyze, visualize.
## Best practices
| Tip | Why it helps |
| -------------------------- | ------------------------------------------------------ |
| Store tokens in env vars | Avoids accidental leakage in shell history and scripts |
| Use limited retries in dev | Keeps logs clean; `--max-retries 0` for dev is fine |
| Run under a supervisor | Use Docker, systemd, or PM2 for HA and auto‑restart |
| Restrict DB credentials | Least-privilege DB user reduces blast radius |
```
export TUNNEL_TOKEN=your-token
rabbit.go tunnel --server rabbit.synehq.com:9999 --token $TUNNEL_TOKEN --local-port 3000
```
## Troubleshooting
* Verify DB accepts connections from `localhost`
* Check the **port** matches your service (e.g., 5432 for Postgres)
* Confirm DB user/password and database name
* Ensure your DB SSL mode matches your setup (disable in local dev if needed)
* Behind corporate proxies? Check proxy/SSL inspection rules
* Prefer wired over flaky Wi‑Fi for long‑running sessions
* Try a closer region or contact support for routing help
For advanced usage, configuration flags, and integration scenarios, see the full Rabbit Tunnel Client guide.
Explore advanced flags, service configs, and automation patterns
# SyneHQ x Elasticsearch Integration
Source: https://docs.synehq.com/features/nosql/elasticsearch
Learn how to use Elasticsearch seamlessly within SyneHQ—setup, features, advanced queries, and troubleshooting.
New Release! SyneHQ natively integrates with Elasticsearch—run complex queries, analyze logs, and visualize data in real-time.
* Native Elasticsearch container support: Connect instantly to your clusters—on-prem or cloud.
* Cloud deployment integration: Works across AWS, GCP, Azure, etc.
* Real-time chat interface: Ask questions about your data—no SQL required.
* Seamless query execution: Just type a prompt, see instant results or visualizations.
* Role-based dashboards: Custom views for SREs, Data Analysts, and App Engineers.
## 🏁 Getting Started
* You need an active SyneHQ account with Admin access.
* An Elasticsearch instance (7.x or higher recommended), cloud or self-hosted.
* API endpoint URL & credentials for Elasticsearch.
### Step-by-Step Setup
1. In SyneHQ, go to `Integrations → Add Data Source`
2. Select Elasticsearch from the list.
3. Enter:
* Cluster URL
* API Key or Basic Auth credentials
* (Optional) Index pattern(s)
4. Click Test Connection. If successful, click Connect.
5. SyneHQ auto-indexes your schemas—query instantly!
## 💡 Example Natural Language Queries
1. `Show me all error logs from the last hour`
2. `Find users with high transaction volumes`
3. `Analyze API response times by endpoint over the past day`
4. `Search for security anomalies in user behavior`
5. `List unique browsers used by admin users this week`
## 📊 Advanced Features
* Automatic chart suggestions based on your query
* Compare metrics (e.g., avg. response time by endpoint)
* Drill-down capabilities for multi-dimensional analytics
* Share queries and dashboards with your team
* Schedule jobs to monitor error spikes and KPI changes
* Receive Slack/Email alerts on anomalies or thresholds
## 📝 Demo Video: Walkthrough
* See the setup and core workflow, including:
* Code editor with prompt-to-query interface
* Live dashboards for error log analysis & more
* How to use conversational search with complex filters
## 🦾 Pro Tips
* Use index wildcards (e.g.,
log-\*) for broad search
* Stack queries for custom dashboards (response time, error count)
* Secure your data—use API Keys with granular perms
* Leverage saved query templates for recurring reports
## 🛟 Troubleshooting
* Check that your Elasticsearch instance is reachable and not firewalled.
* Re-verify your API Key/credentials.
* Ensure index patterns are correct.
***
Need more help? Ping @theboringhumane on X, or join the SyneHQ Community Slack for support and feature requests.
# MongoDB Shell (mongosh)
Source: https://docs.synehq.com/features/nosql/mongosh
Execute native MongoDB queries and aggregation pipelines with mongosh syntax
Execute native MongoDB queries and aggregation pipelines directly using mongosh syntax. SyneHQ provides full support for MongoDB's native query language, allowing you to leverage the complete power of MongoDB operations.
![MongoDB Shell Interface]() ## Why Use Mongosh?
Use MongoDB's native query language without any abstraction layers
Access all MongoDB operations including aggregation pipelines and complex queries
Direct execution against MongoDB with no translation overhead
Standard mongosh syntax that MongoDB developers already know
## [Aggregation Pipeline](https://www.mongodb.com/docs/manual/core/aggregation-pipeline/#aggregation-pipeline)
This section shows aggregation pipeline examples that use the following pizza orders collection:
### Complete Aggregation Pipeline Example
```bash theme={"system"}
db.orders.insertMany( [
{ _id: 0, name: "Pepperoni", size: "small", price: 19,
quantity: 10, date: ISODate( "2021-03-13T08:14:30Z" ) },
{ _id: 1, name: "Pepperoni", size: "medium", price: 20,
quantity: 20, date : ISODate( "2021-03-13T09:13:24Z" ) },
{ _id: 2, name: "Pepperoni", size: "large", price: 21,
quantity: 30, date : ISODate( "2021-03-17T09:22:12Z" ) },
{ _id: 3, name: "Cheese", size: "small", price: 12,
quantity: 15, date : ISODate( "2021-03-13T11:21:39.736Z" ) },
{ _id: 4, name: "Cheese", size: "medium", price: 13,
quantity:50, date : ISODate( "2022-01-12T21:23:13.331Z" ) },
{ _id: 5, name: "Cheese", size: "large", price: 14,
quantity: 10, date : ISODate( "2022-01-12T05:08:13Z" ) },
{ _id: 6, name: "Vegan", size: "small", price: 17,
quantity: 10, date : ISODate( "2021-01-13T05:08:13Z" ) },
{ _id: 7, name: "Vegan", size: "medium", price: 18,
quantity: 10, date : ISODate( "2021-01-13T05:10:13Z" ) }
])
```
Calculate Total Order Quantity
The following aggregation pipeline example contains two [stages](https://www.mongodb.com/docs/manual/reference/operator/aggregation-pipeline/#std-label-aggregation-pipeline-operator-reference) and returns the total order quantity of medium size pizzas grouped by pizza name:
```bash theme={"system"}
db.orders.aggregate([
// Stage 1: Filter pizza order documents by pizza size
{
$match: { size: "medium" }
},
// Stage 2: Group remaining documents by pizza name and calculate total quantity
{
$group: { _id: "$name", totalQuantity: { $sum: "$quantity" } }
}
] )
```
For more consult mongodb docs here —
\> [https://www.mongodb.com/docs/manual/introduction/](https://www.mongodb.com/docs/manual/introduction/)
# No-Code Query Builder
Source: https://docs.synehq.com/features/query-builder
Visual query construction for users of all technical levels
The No-Code Query Builder empowers users—regardless of SQL knowledge—to visually create, customize, and run data queries. This intuitive interface delivers quick business insights through a guided, code-free experience, making data analysis accessible to analysts, product managers, and business users.
Transform your data exploration with **visual query construction**. No SQL required—just point, click, and analyze.
## Overview
### No Code Query Builder

The No-Code Query Builder is a visual interface that enables users to construct database queries through guided steps rather than writing code. It bridges the gap between technical and non-technical users by providing:
* **Visual Query Construction**: Build queries through point-and-click interface
* **Natural Language Input**: Ask questions in plain English
* **Instant Results**: See data immediately as you build
* **SQL Transparency**: View generated SQL for learning and refinement
* **Save & Share**: Preserve queries and visualizations for team collaboration
The Query Builder is designed for diverse user personas:
**Business Analysts**
* Create reports without technical dependencies
* Explore data trends and patterns quickly
* Build dashboards for stakeholder presentations
**Product Managers**
* Analyze user behavior and product metrics
* Track feature adoption and engagement
* Generate insights for data-driven decisions
**Marketing Teams**
* Segment customer data for campaigns
* Track conversion metrics and attribution
* Analyze campaign performance across channels
**SQL Beginners**
* Learn query construction through visual guidance
* Understand SQL generation from visual inputs
* Graduate to advanced SQL writing with confidence
## Core Features
### Natural Language Analytics Panel
The prominent natural language panel enables intuitive data interaction:
**Ask Questions Naturally**
* "What are our top-performing products this quarter?"
* "Show me user engagement trends over the past 30 days"
* "Which marketing channels drive the most conversions?"
**Intelligent Query Interpretation**
* AI understands context and intent from your questions
* Automatically selects appropriate tables and columns
* Suggests relevant filters and aggregations
* Generates optimized SQL queries behind the scenes
**Interactive Refinement**
* Ask follow-up questions to drill deeper
* Modify queries through conversation
* Get explanations of results and insights
### Visual Query Construction

The visual builder follows a logical, guided workflow:
**1. Data Source Selection**
* Choose your target database from connected sources
* Browse available databases with clear descriptions
* See connection status and data freshness indicators
**2. Table Selection**
* Pick the primary table for your analysis
* View table descriptions and row counts
* See column previews and data types
**3. Column Configuration**
* Select specific columns to include in results
* Choose from available columns with data type indicators
* Add calculated fields and aggregations
* Rename columns for clearer output
**4. Filter Application**
* Apply conditions to narrow down results
* Use visual filter builders for different data types
* Combine multiple filters with AND/OR logic
* Preview filter effects before execution
**5. Join Configuration (Optional)**
* Add related data from other tables
* Visual join builder with relationship suggestions
* Support for INNER, LEFT, RIGHT, and FULL OUTER joins
* Join condition validation and optimization
**6. Sorting & Limits**
* Set result ordering (ascending/descending)
* Configure row limits for performance
* Multiple sort criteria support
* Smart defaults based on data types
**Aggregation & Grouping**
* Group results by specific columns
* Apply aggregate functions (COUNT, SUM, AVG, MIN, MAX)
* Create calculated metrics and ratios
* Handle null values and edge cases
**Date & Time Handling**
* Intelligent date range pickers
* Relative date filters ("last 30 days", "this quarter")
* Time zone conversion and formatting
* Date part extraction (year, month, day of week)
**Text & String Operations**
* Pattern matching and text search
* Case-insensitive comparisons
* String concatenation and formatting
* Regular expression support for advanced users
### Execution & Results
**Instant Execution**
* Run queries with a single click
* Real-time result streaming for large datasets
* Progress indicators for long-running queries
* Cancellation support for resource management
**Performance Optimization**
* Automatic query optimization suggestions
* Row limit recommendations based on data size
* Index usage analysis and recommendations
* Query cost estimation before execution
**Error Handling**
* Clear error messages with suggested fixes
* Visual indicators for invalid configurations
* Rollback to previous working configurations
* AI-powered error resolution assistance
**Multiple Display Formats**
* Tabular data grid with sorting and filtering
* Interactive charts and graphs
* Summary statistics and data profiles
* Export options (CSV, JSON, PDF)
**Chart Generation**
* Automatic chart type recommendations
* Customizable visualizations
* Interactive charts with drill-down capabilities
* Dashboard-ready widgets
**Data Insights**
* Automatic pattern detection
* Statistical summaries and distributions
* Anomaly highlighting
* Trend analysis and forecasting hints
## Workflow Examples
**Scenario**: Analyze checkout events for the past month to understand conversion patterns.
**Step-by-Step Process**:
1. **Data Source**: Select "E-commerce Database"
2. **Table**: Choose "events" table
3. **Columns**: Select event\_name, event\_timestamp, user\_id, product\_id, revenue
4. **Filters**:
* event\_name = 'checkout\_started' OR 'checkout\_completed'
* event\_timestamp >= 30 days ago
5. **Grouping**: Group by event\_name and date
6. **Aggregation**: Count events and sum revenue
7. **Sorting**: Order by date descending
8. **Visualization**: Generate conversion funnel chart
**Expected Output**: Visual conversion analysis showing checkout completion rates and revenue trends over time.
**Scenario**: Segment users based on engagement patterns and purchase history.
**Step-by-Step Process**:
1. **Data Source**: Select "Customer Database"
2. **Table**: Start with "users" table
3. **Joins**: Add "orders" and "sessions" tables
4. **Columns**: user\_id, registration\_date, total\_orders, session\_count, last\_activity
5. **Calculations**: Create engagement\_score and customer\_lifetime\_value
6. **Filters**: Active users in last 90 days
7. **Grouping**: Segment by engagement level
8. **Visualization**: Create user segment distribution chart
**Expected Output**: Customer segments with behavioral characteristics and value metrics.
**Scenario**: Analyze marketing campaign effectiveness across different channels.
**Step-by-Step Process**:
1. **Data Source**: Select "Marketing Database"
2. **Table**: Choose "campaigns" table
3. **Joins**: Connect to "conversions" and "costs" tables
4. **Columns**: campaign\_name, channel, impressions, clicks, conversions, cost
5. **Calculations**: CTR, conversion\_rate, ROAS, cost\_per\_acquisition
6. **Filters**: Last quarter campaigns only
7. **Grouping**: Group by channel and campaign type
8. **Sorting**: Order by ROAS descending
9. **Visualization**: Multi-metric performance dashboard
**Expected Output**: Comprehensive campaign performance analysis with ROI insights.
## Advanced Features
**Generated SQL Viewing**
* See the SQL query generated from your visual configuration
* Learn SQL syntax through example
* Copy generated queries for manual editing
* Understand query optimization techniques
**SQL Editor Integration**
* Seamlessly switch between visual and SQL modes
* Edit generated SQL directly for advanced customization
* Visual builder updates when SQL is modified (where possible)
* Syntax highlighting and auto-completion support
**Query Explanation**
* AI-powered explanations of query logic
* Performance impact analysis
* Alternative query suggestions
* Best practices recommendations
**Save & Organize**
* Save queries with descriptive names and tags
* Organize saved queries in folders and categories
* Version control for query iterations
* Duplicate and modify existing queries
**Team Sharing**
* Share queries with team members
* Collaborative editing and commenting
* Role-based access control for sensitive data
* Usage analytics and adoption tracking
**Export & Integration**
* Export results in multiple formats
* Schedule automated query execution
* Integrate with BI tools and dashboards
* API access for programmatic usage
**Pre-built Prompts**
* Industry-specific query templates
* Common business questions and patterns
* Best practice examples for different use cases
* Customizable prompt library
**Smart Suggestions**
* Context-aware column and filter suggestions
* Join recommendations based on schema relationships
* Optimization hints for query performance
* Data quality warnings and recommendations
**Template Management**
* Create custom templates for repeated analyses
* Share templates across teams
* Template versioning and updates
* Usage tracking and optimization
## Getting Started
**Step 1: Access the Query Builder**
* Navigate to the Query Builder from the main dashboard
* Select "Visual Builder" mode if prompted
* Ensure you have proper database permissions
**Step 2: Try Natural Language**
* Click in the natural language panel
* Type a simple question like "Show me all customers from last month"
* Review the generated query and results
* Refine using follow-up questions
**Step 3: Explore Visual Building**
* Start with data source selection
* Browse available tables and their descriptions
* Add a few columns and basic filters
* Execute your first visual query
**Step 4: Save and Share**
* Save your successful query with a descriptive name
* Add tags for easy discovery
* Share with team members if needed
* Explore visualization options
**Query Design**
* Start simple and add complexity gradually
* Use filters early to reduce data volume
* Test with row limits before removing restrictions
* Document complex queries with descriptions
**Performance Optimization**
* Apply filters before joins when possible
* Use appropriate row limits for exploration
* Monitor query execution times
* Leverage suggested optimizations
**Collaboration**
* Use descriptive names for saved queries
* Add context and documentation for team queries
* Tag queries by project or use case
* Share insights and findings with stakeholders
## Reference
### Feature Comparison Table
| Feature | Visual Builder | Natural Language | SQL Editor |
| ----------------------------- | -------------- | ---------------- | ----------- |
| **Ease of Use** | ⭐⭐⭐⭐⭐ | ⭐⭐⭐⭐⭐ | ⭐⭐⭐ |
| **Flexibility** | ⭐⭐⭐⭐ | ⭐⭐⭐ | ⭐⭐⭐⭐⭐ |
| **Learning Curve** | Low | Very Low | Medium-High |
| **Query Complexity** | Medium-High | Medium | Unlimited |
| **Speed for Simple Queries** | Fast | Very Fast | Medium |
| **Speed for Complex Queries** | Medium | Medium | Fast |
### Keyboard Shortcuts
| Action | Shortcut | Description |
| ----------------- | ---------------------- | ----------------------------------- |
| **Run Query** | `Ctrl/Cmd + Enter` | Execute current query configuration |
| **Save Query** | `Ctrl/Cmd + S` | Save current query and settings |
| **Clear Filters** | `Ctrl/Cmd + K` | Remove all applied filters |
| **Switch to SQL** | `Ctrl/Cmd + Shift + S` | Toggle to SQL editor mode |
| **Add Column** | `Ctrl/Cmd + +` | Add new column to selection |
| **Remove Column** | `Ctrl/Cmd + -` | Remove selected column |
Switch to the advanced Query Console for SQL editing and complex operations
Connect your databases and data sources
Create charts and dashboards from your queries
# GA4 SQL: Query Google Analytics 4 with Standard SQL
Source: https://docs.synehq.com/features/sql-bridge/ga4
Query your GA4 data using standard SQL syntax. Transform analytics insights into actionable data queries.
**Google Analytics 4 SQL Bridge** - Query your GA4 data using standard SQL syntax. Transform analytics insights into actionable data queries.
## Overview
The GA4 SQL Driver allows you to query your Google Analytics 4 property using familiar SQL syntax. This integration transforms GA4's Data API into a SQL-queryable interface, making it easy to analyze your analytics data alongside other databases.
![]() ## Quick Start
### 1. Set up Google Service Account
**Add our service account email as a Viewer to your GA4 property (find email below)**
**[data-team@synehq.iam.gserviceaccount.com](mailto:data-team@synehq.iam.gserviceaccount.com)**
### 2. Connect SyneHQ to your GA4 Property
Navigate to [Add Connections](https://data.synehq.com/connections)
![GA4 Connection Setup]() #### 3. Run Your First Query
```sql theme={"system"}
-- Explore available data
SELECT * FROM ga4
WHERE date BETWEEN '2024-01-01' AND '2024-01-07'
LIMIT 5;
-- Get top countries by user count
SELECT country, totalUsers, sessions
FROM ga4
WHERE date BETWEEN '2024-01-01' AND '2024-01-31'
GROUP BY country
ORDER BY totalUsers DESC
LIMIT 10;
```
#### Finding Your Property ID
Your GA4 Property ID is the numeric ID (not the Measurement ID starting with G-):
1. Go to GA4 Admin > Property Settings
2. Copy the **Property ID** (numeric, e.g., `123456789`)
### SQL Syntax Reference
#### Supported SQL Subset
The GA4 driver supports a focused SQL subset optimized for analytics queries:
```sql theme={"system"}
SELECT
FROM ga4
[WHERE date BETWEEN 'YYYY-MM-DD' AND 'YYYY-MM-DD'
[AND = 'value' ...]]
[GROUP BY ]
[ORDER BY [ASC|DESC]]
[LIMIT N [OFFSET M]]
```
#### Field Types
* **Dimensions**: Categorical data (country, deviceCategory, source, etc.)
* **Metrics**: Numerical data (totalUsers, sessions, revenue, etc.)
#### Metric Prefixing
Metrics can be prefixed with `m:` for clarity (optional):
```sql theme={"system"}
-- Both are equivalent:
SELECT country, totalUsers FROM ga4;
SELECT country, m:totalUsers FROM ga4;
```
#### Date Filtering
Date filtering is **required** for data queries:
```sql theme={"system"}
-- Required date range
WHERE date BETWEEN '2024-01-01' AND '2024-01-31'
-- Combined with other filters
WHERE date BETWEEN '2024-01-01' AND '2024-01-31'
AND country = 'United States'
AND deviceCategory = 'mobile'
```
### Discovery Commands
Explore available data with these special SQL commands:
#### List Available Fields
```sql theme={"system"}
-- List all dimensions
LIST DIMENSIONS;
-- List all metrics
LIST METRICS;
-- List both dimensions and metrics
LIST FIELDS;
-- Limit results
LIST DIMENSIONS LIMIT 10;
```
#### Schema Exploration
```sql theme={"system"}
-- Show databases
SHOW DATABASES;
-- Show schemas
SHOW SCHEMAS;
-- Show tables
SHOW TABLES;
-- Describe the ga4 table
DESCRIBE ga4;
DESC TABLE ga4;
```
### Query Examples
#### Basic Analytics
```sql theme={"system"}
-- Daily active users over time
SELECT date, activeUsers, newUsers
FROM ga4
WHERE date BETWEEN '2024-01-01' AND '2024-01-31'
ORDER BY date;
-- Top traffic sources
SELECT source, medium, totalUsers, sessions
FROM ga4
WHERE date BETWEEN '2024-01-01' AND '2024-01-31'
GROUP BY source, medium
ORDER BY totalUsers DESC
LIMIT 10;
```
#### Device & Technology Analysis
```sql theme={"system"}
-- Device category breakdown
SELECT deviceCategory, operatingSystem, activeUsers, bounceRate
FROM ga4
WHERE date BETWEEN '2024-01-01' AND '2024-01-31'
AND country = 'United States'
GROUP BY deviceCategory, operatingSystem
ORDER BY activeUsers DESC;
-- Browser performance
SELECT browser, browserVersion, totalUsers, engagementRate
FROM ga4
WHERE date BETWEEN '2024-01-01' AND '2024-01-31'
GROUP BY browser, browserVersion
HAVING totalUsers > 100
ORDER BY engagementRate DESC;
```
#### Geographic Analysis
```sql theme={"system"}
-- Country performance
SELECT country, region, totalUsers, sessions, engagementRate
FROM ga4
WHERE date BETWEEN '2024-01-01' AND '2024-01-31'
GROUP BY country, region
ORDER BY totalUsers DESC
LIMIT 20;
-- City-level analysis
SELECT city, country, activeUsers, averageSessionDuration
FROM ga4
WHERE date BETWEEN '2024-01-01' AND '2024-01-31'
AND country IN ('United States', 'Canada', 'United Kingdom')
GROUP BY city, country
ORDER BY activeUsers DESC;
```
#### Page Performance
```sql theme={"system"}
-- Top pages by views
SELECT pagePath, pageTitle, screenPageViews, uniquePageviews
FROM ga4
WHERE date BETWEEN '2024-01-01' AND '2024-01-31'
GROUP BY pagePath, pageTitle
ORDER BY screenPageViews DESC
LIMIT 15;
-- Landing page analysis
SELECT landingPage, totalUsers, bounceRate, engagementRate
FROM ga4
WHERE date BETWEEN '2024-01-01' AND '2024-01-31'
GROUP BY landingPage
ORDER BY totalUsers DESC;
```
#### Campaign Analysis
```sql theme={"system"}
-- Campaign performance
SELECT campaignName, source, medium, totalUsers, conversions, totalRevenue
FROM ga4
WHERE date BETWEEN '2024-01-01' AND '2024-01-31'
AND campaignName IS NOT NULL
GROUP BY campaignName, source, medium
ORDER BY totalRevenue DESC;
-- Channel performance
SELECT sessionDefaultChannelGroup, activeUsers, sessions, engagementRate
FROM ga4
WHERE date BETWEEN '2024-01-01' AND '2024-01-31'
GROUP BY sessionDefaultChannelGroup
ORDER BY activeUsers DESC;
```
#### E-commerce Analysis
```sql theme={"system"}
-- Revenue by source
SELECT source, medium, totalRevenue, ecommercePurchases,
totalRevenue / ecommercePurchases as avgOrderValue
FROM ga4
WHERE date BETWEEN '2024-01-01' AND '2024-01-31'
AND totalRevenue > 0
GROUP BY source, medium
ORDER BY totalRevenue DESC;
-- Product performance
SELECT itemName, itemCategory, itemRevenue, itemsPurchased
FROM ga4
WHERE date BETWEEN '2024-01-01' AND '2024-01-31'
AND itemName IS NOT NULL
GROUP BY itemName, itemCategory
ORDER BY itemRevenue DESC;
```
#### Event Analysis
```sql theme={"system"}
-- Top events
SELECT eventName, eventCount, totalUsers
FROM ga4
WHERE date BETWEEN '2024-01-01' AND '2024-01-31'
GROUP BY eventName
ORDER BY eventCount DESC
LIMIT 10;
-- Event funnel analysis
SELECT eventName, deviceCategory, eventCount,
eventCount / totalUsers as eventsPerUser
FROM ga4
WHERE date BETWEEN '2024-01-01' AND '2024-01-31'
AND eventName IN ('page_view', 'scroll', 'click', 'purchase')
GROUP BY eventName, deviceCategory
ORDER BY eventName, eventsPerUser DESC;
```
### Field Reference
#### Common Dimensions
| Field | Description |
| ---------------------------- | ------------------------------------- |
| `date` | Date in YYYY-MM-DD format |
| `country` | User's country |
| `region` | User's region/state |
| `city` | User's city |
| `deviceCategory` | Device type (desktop, mobile, tablet) |
| `operatingSystem` | Operating system |
| `browser` | Browser name |
| `source` | Traffic source |
| `medium` | Traffic medium |
| `campaignName` | Campaign name |
| `sessionDefaultChannelGroup` | Default channel grouping |
| `pagePath` | Page path |
| `pageTitle` | Page title |
| `eventName` | Event name |
#### Common Metrics
| Field | Description |
| ------------------------ | --------------------------- |
| `totalUsers` | Total number of users |
| `activeUsers` | Number of active users |
| `newUsers` | Number of new users |
| `sessions` | Number of sessions |
| `engagedSessions` | Number of engaged sessions |
| `engagementRate` | Engagement rate percentage |
| `bounceRate` | Bounce rate percentage |
| `screenPageViews` | Number of page/screen views |
| `averageSessionDuration` | Average session duration |
| `conversions` | Number of conversions |
| `totalRevenue` | Total revenue |
| `eventCount` | Number of events |
#### Discovery Commands
```sql theme={"system"}
-- Get complete field lists
LIST DIMENSIONS; -- All available dimensions
LIST METRICS; -- All available metrics
LIST FIELDS; -- Both dimensions and metrics
DESCRIBE ga4; -- Table schema with data types
```
### Best Practices
#### 1. Always Include Date Ranges
```sql theme={"system"}
-- ✅ Good: Always filter by date
SELECT country, totalUsers FROM ga4
WHERE date BETWEEN '2024-01-01' AND '2024-01-31';
-- ❌ Bad: Missing date filter (will fail)
SELECT country, totalUsers FROM ga4;
```
#### 2. Use Appropriate Aggregation
```sql theme={"system"}
-- ✅ Good: Group by dimensions when using metrics
SELECT country, SUM(totalUsers) as users FROM ga4
WHERE date BETWEEN '2024-01-01' AND '2024-01-31'
GROUP BY country;
-- ✅ Good: Use built-in aggregated metrics
SELECT country, totalUsers FROM ga4
WHERE date BETWEEN '2024-01-01' AND '2024-01-31'
GROUP BY country;
```
#### 3. Optimize Query Performance
```sql theme={"system"}
-- ✅ Good: Use specific date ranges
WHERE date BETWEEN '2024-01-01' AND '2024-01-31'
-- ✅ Good: Limit results
LIMIT 100
-- ✅ Good: Filter early
WHERE date BETWEEN '2024-01-01' AND '2024-01-31'
AND country = 'United States'
```
#### 4. Handle GA4 Limitations
```sql theme={"system"}
-- ✅ Good: Respect GA4 cardinality limits
SELECT country, totalUsers FROM ga4
WHERE date BETWEEN '2024-01-01' AND '2024-01-31'
GROUP BY country
LIMIT 1000;
-- ⚠️ Be careful with high-cardinality dimensions
SELECT pagePath, totalUsers FROM ga4
WHERE date BETWEEN '2024-01-01' AND '2024-01-31'
GROUP BY pagePath
LIMIT 100; -- Limit to avoid sampling
```
### Troubleshooting
#### Common Errors
**1. "Field X is not a valid dimension"**
```sql theme={"system"}
-- ❌ Error: Invalid field name
SELECT campaign FROM ga4;
-- ✅ Fix: Use correct field name
SELECT campaignName FROM ga4;
```
**Solution**: Use `LIST DIMENSIONS` to see valid field names.
**2. "User does not have sufficient permissions"**
**Solution**: Ensure your service account has Viewer access to the GA4 property.
**3. "Property not found"**
**Solution**: Verify you're using the correct Property ID (numeric, not Measurement ID).
**4. Missing date range**
```sql theme={"system"}
-- ❌ Error: Missing required date filter
SELECT country, totalUsers FROM ga4;
-- ✅ Fix: Always include date range
SELECT country, totalUsers FROM ga4
WHERE date BETWEEN '2024-01-01' AND '2024-01-31';
```
#### Debugging Tips
1. **Start Simple**: Begin with basic queries and add complexity gradually
2. **Check Field Names**: Use discovery commands to verify field names
3. **Test Date Ranges**: Ensure your date range contains data
4. **Monitor Limits**: Be aware of GA4's sampling and cardinality limits
5. **Check Permissions**: Verify service account access
#### Performance Optimization
1. **Use Shorter Date Ranges** for faster queries
2. **Limit Results** with `LIMIT` clause
3. **Filter Early** with `WHERE` conditions
4. **Avoid High-Cardinality** dimensions when possible
5. **Cache Results** for repeated queries
### Advanced Usage
#### Custom Calculated Fields
```sql theme={"system"}
-- Calculate conversion rate
SELECT source, medium,
conversions,
totalUsers,
(conversions * 100.0 / totalUsers) as conversionRate
FROM ga4
WHERE date BETWEEN '2024-01-01' AND '2024-01-31'
AND totalUsers > 0
GROUP BY source, medium
ORDER BY conversionRate DESC;
-- Calculate revenue per user
SELECT country,
totalRevenue,
totalUsers,
(totalRevenue / totalUsers) as revenuePerUser
FROM ga4
WHERE date BETWEEN '2024-01-01' AND '2024-01-31'
AND totalUsers > 0
GROUP BY country
ORDER BY revenuePerUser DESC;
```
#### Time Series Analysis
```sql theme={"system"}
-- Weekly trends
SELECT
CONCAT(year, '-W', LPAD(week, 2, '0')) as week_label,
SUM(totalUsers) as weekly_users,
SUM(sessions) as weekly_sessions
FROM ga4
WHERE date BETWEEN '2024-01-01' AND '2024-03-31'
GROUP BY year, week
ORDER BY year, week;
-- Month-over-month comparison
SELECT
yearMonth,
totalUsers,
LAG(totalUsers) OVER (ORDER BY yearMonth) as prev_month_users,
((totalUsers - LAG(totalUsers) OVER (ORDER BY yearMonth)) * 100.0 /
LAG(totalUsers) OVER (ORDER BY yearMonth)) as growth_rate
FROM (
SELECT yearMonth, SUM(totalUsers) as totalUsers
FROM ga4
WHERE date BETWEEN '2024-01-01' AND '2024-12-31'
GROUP BY yearMonth
) monthly_data
ORDER BY yearMonth;
```
***
### Getting Help
* **Field Reference**: Use `LIST DIMENSIONS` and `LIST METRICS` commands
* **Schema Info**: Use `DESCRIBE ga4` for table structure
* **GA4 Documentation**: [GA4 Data API Schema](https://developers.google.com/analytics/devguides/reporting/data/v1/api-schema)
* **Error Messages**: Check the `details` field in error responses for specific guidance
Start exploring your GA4 data with SQL today! 🚀
# Zero-SQL for MongoDB
Source: https://docs.synehq.com/features/sql-bridge/mongodb
Write SQL queries against MongoDB databases with our intelligent AST-based converter
Zero-SQL transforms MongoDB querying by enabling SQL syntax directly against MongoDB collections. Our AST-based converter intelligently translates SQL queries into MongoDB aggregation pipelines, making MongoDB accessible to SQL developers while maintaining the full power of both query languages.
![Zero-SQL MongoDB Interface]() ## Why Zero-SQL?
Use standard SQL SELECT, JOIN, WHERE, and GROUP BY statements with MongoDB
Leverage existing SQL knowledge without learning MongoDB query syntax
AST-based converter ensures accurate and optimized MongoDB pipeline generation
Built in Go for lightning-fast query processing and execution
## Supported SQL Features
Zero-SQL provides comprehensive SQL functionality with intelligent MongoDB translation:
* Column selection and wildcards (`SELECT name, email` or `SELECT *`)
* Column aliases (`SELECT name AS full_name`)
* Aggregation functions (`COUNT()`, `SUM()`, `AVG()`, `MIN()`, `MAX()`)
* Quoted column names for special characters
* INNER JOIN, LEFT JOIN, RIGHT JOIN
* Multiple table joins with aliases
* Complex join conditions
* Nested join operations
* Comparison operators (`=`, `!=`, `>`, `<`, `>=`, `<=`)
* Pattern matching (`LIKE`, `ILIKE`)
* List operations (`IN`, `NOT IN`)
* NULL checks (`IS NULL`, `IS NOT NULL`)
* Logical operators (`AND`, `OR`, `NOT`)
* Parenthetical grouping
* GROUP BY single or multiple columns
* HAVING clauses for filtered aggregations
* ORDER BY with ASC/DESC sorting
* LIMIT and OFFSET for pagination
## Query Examples
### Basic Operations
#### Examples
**Simple SELECT with WHERE**
```sql theme={"system"}
SELECT name, email FROM users WHERE active = true
```
This means:
```json theme={"system"}
[
{
"$match": {
"active": true
}
},
{
"$project": {
"_id": 0,
"name": "$name",
"email": "$email"
}
}
]
```
**Quoted Column Names**
Zero-SQL fully supports quoted identifiers for column names with spaces or special characters:
```sql theme={"system"}
SELECT "User Name", "Email Address" FROM users WHERE "Created Date" > '\''2023-01-01'\''
```
**JOIN Operations**
**Simple INNER JOIN**
```sql theme={"system"}
SELECT u.name, p.title FROM users u JOIN posts p ON u.id = p.user_id
```
This means:
```json theme={"system"}
[
{
"$lookup": {
"from": "posts",
"localField": "id",
"foreignField": "user_id",
"as": "p"
}
},
{
"$unwind": "$p"
},
{
"$project": {
"_id": 0,
"name": "$u.name",
"title": "$p.title"
}
}
]
```
**LEFT JOIN**
```sql theme={"system"}
SELECT u.name, p.title FROM users u LEFT JOIN posts p ON u.id = p.user_id
```
This means:
```json theme={"system"}
[
{
"$lookup": {
"from": "posts",
"localField": "id",
"foreignField": "user_id",
"as": "p"
}
},
{
"$unwind": {
"path": "$p",
"preserveNullAndEmptyArrays": true
}
},
{
"$project": {
"_id": 0,
"name": "$u.name",
"title": "$p.title"
}
}
]
```
**Multiple JOINs**
```sql theme={"system"}
SELECT u.name, p.title, c.name as category FROM users u
JOIN posts p ON u.id = p.user_id
JOIN categories c ON p.category_id = c.id
```
This means:
```json theme={"system"}
[
{
"$lookup": {
"from": "posts",
"localField": "id",
"foreignField": "user_id",
"as": "p"
}
},
{
"$unwind": "$p"
},
{
"$lookup": {
"from": "categories",
"localField": "category_id",
"foreignField": "id",
"as": "c"
}
},
{
"$unwind": "$c"
},
{
"$project": {
"_id": 0,
"category": "$c.name",
"name": "$u.name",
"title": "$p.title"
}
}
]
```
**GROUP BY with Aggregation**
```sql theme={"system"}
SELECT status, COUNT(*) as total FROM orders GROUP BY status
```
This means:
```json theme={"system"}
[
{
"$group": {
"_id": {
"status": "$status"
},
"total": {
"$sum": 1
}
}
}
]
```
**Complex WHERE Conditions**
```sql theme={"system"}
SELECT * FROM products WHERE (price > 100 AND category = 'electronics')
OR (price < 50 AND category = 'books')
```
**LIKE and Pattern Matching**
```sql theme={"system"}
SELECT name FROM users WHERE email ILIKE '%@gmail.com'
```
**ORDER BY and LIMIT**
```sql theme={"system"}
SELECT name, created_at FROM users ORDER BY created_at DESC LIMIT 10
```
**Complex Investment Analysis Example**
```sql theme={"system"}
SELECT _id, "Date", "Description", "Operation", SUM("Amount") AS Total_Amount, COUNT(_id) AS Investment_Count, AVG("Amount") AS Average_Investment_Amount FROM investments WHERE "Date" BETWEEN '\''2023-01-01'\'' AND '\''2023-12-31'\'' AND "Operation" IN ('\''Deposit'\'', '\''Withdrawal'\'') GROUP BY _id, "Date", "Description", "Operation" ORDER BY Total_Amount DESC LIMIT 50;
```
This means:
```json theme={"system"}
[
{
"$match": {
"$and": [
{
"Date": {
"$gte": "2023-01-01",
"$lte": "2023-12-31"
}
},
{
"Operation": {
"$in": ["Deposit", "Withdrawal"]
}
}
]
}
},
{
"$group": {
"Average_Investment_Amount": {"$avg": "$Amount"},
"Investment_Count": {
"$sum": {
"$cond": [{"$ne": ["$_id", null]}, 1, 0]
}
},
"Total_Amount": {"$sum": "$Amount"},
"_id": {
"Date": "$Date",
"Description": "$Description",
"Operation": "$Operation",
"_id": "$_id"
}
}
},
{
"$sort": {"Total_Amount": -1}
},
{
"$limit": 50
}
]
```
### Supported SQL Features
#### SELECT Clause
* Column selection: `SELECT name, age`
* Wildcard: `SELECT *`
* Column aliases: `SELECT name AS full_name`
* Aggregation functions: `COUNT()`, `SUM()`, `AVG()`, `MIN()`, `MAX()`
#### FROM Clause
* Table references: `FROM users`
* Table aliases: `FROM users u`
#### JOIN Clause
* INNER JOIN: `INNER JOIN posts ON users.id = posts.user_id`
* LEFT JOIN: `LEFT JOIN posts ON users.id = posts.user_id`
* Table aliases in JOINs: `FROM users u JOIN posts p ON u.id = p.user_id`
* Multiple JOINs: `FROM users u JOIN posts p ON u.id = p.user_id JOIN categories c ON p.category_id = c.id`
* JOINs with WHERE conditions: `FROM users u JOIN posts p ON u.id = p.user_id WHERE u.active = true`
#### WHERE Clause
* Comparison operators: `=`, `!=`, `<>`, `>`, `<`, `>=`, `<=`
* Pattern matching: `LIKE`, `ILIKE`
* List operations: `IN`, `NOT IN`
* NULL checks: `IS NULL`, `IS NOT NULL`
* Logical operators: `AND`, `OR`, `NOT`
* Parentheses for grouping: `(condition1 OR condition2) AND condition3`
#### GROUP BY Clause
* Single column: `GROUP BY status`
* Multiple columns: `GROUP BY category, status`
* Works with aggregation functions in SELECT
#### HAVING Clause
* Filter aggregated results: `HAVING COUNT(*) > 5`
* Supports same operators as WHERE clause
#### ORDER BY Clause
* Ascending: `ORDER BY name` or `ORDER BY name ASC`
* Descending: `ORDER BY created_at DESC`
* Multiple columns: `ORDER BY category, name DESC`
#### LIMIT and OFFSET
* Limit results: `LIMIT 10`
* Skip results: `OFFSET 20` or `LIMIT 20, 10`
### MongoDB Output
\`zero-sql\` generates MongoDB aggregation pipelines using these stages:
* `$lookup` - for JOIN operations
* `$unwind` - to flatten joined arrays
* `$match` - for WHERE and HAVING clauses
* `$group` - for GROUP BY clauses
* `$project` - for SELECT column specification
* `$sort` - for ORDER BY clauses
* `$skip` - for OFFSET
* `$limit` - for LIMIT
### Error Handling
Zero-SQL provides detailed error messages for:
* Invalid SQL syntax
* Unsupported SQL features
* Type mismatches
* Missing required clauses
### Limitations
Current limitations include:
* Only SELECT statements are supported
* Subqueries are not yet supported
* Window functions are not supported
* Some advanced SQL features may not be available
### Contributing
Contributions are welcome! Please see the Contributing Guide for details. [https://github.com/SyneHQ/zero-sql](https://github.com/SyneHQ/zero-sql/tree/sudo)
### Architecture
The converter package is the heart of the application, handling the conversion from SQL Abstract Syntax Trees (AST) to MongoDB aggregation pipelines.
### Troubleshooting
#### MongoDB Aggregation Namespace Error
If you encounter an error like `(InvalidNamespace) {aggregate: 1} is not valid for '$limit'; a collection is required`, this means that when executing the generated aggregation pipeline in MongoDB, the collection name is not being specified correctly.
Then, in your MongoDB client/driver, use the collection name when executing the aggregation:
```bash theme={"system"}
// MongoDB shell
db.users.aggregate([{"$limit": 10}])
// Node.js with MongoDB driver
await db.collection("users").aggregate([{"$limit": 10}]).toArray()
```
# 🦔 PostHog Integration
Source: https://docs.synehq.com/features/sql-bridge/posthog
Query Your Product Analytics with SQL and APIs
### Overview
The PostHog integration allows you to query your PostHog analytics data using multiple approaches: HogQL (PostHog's SQL dialect), REST API calls, and the PostHog Query API. This integration makes it easy to analyze product analytics data alongside other databases in your data stack.

### Quick Start
> #### 1. Get Your PostHog Credentials
>
> From your PostHog instance:
>
> 1. Get your Project API Key from Project Settings
> 2. Note your Project ID
> 3. Get your PostHog instance URL (e.g., [https://app.posthog.com](https://app.posthog.com))
#### 2. Connect to PostHog
#### 3. Run Your First Query
```sql theme={"system"}
-- HogQL query to get recent events
SELECT event, count() as event_count
FROM events
WHERE timestamp > now() - interval 7 day
GROUP BY event
ORDER BY event_count DESC
LIMIT 10;
-- REST API call to get events
GET /api/projects/:project_id/events?limit=10
-- Query API call for insights
QUERY {"kind": "EventsQuery", "select": ["*"], "limit": 10}
```
### Authentication Setup
#### PostHog Cloud
1. **Get API Key**
* Go to your PostHog project settings
* Navigate to "Project API Key"
* Copy your Project API Key
2. **Find Project ID**
* In PostHog, go to Project Settings
* Copy the Project ID (numeric value)
#### Self-Hosted PostHog
1. **Get Your Instance URL**
```bash theme={"system"}
# Your self-hosted PostHog URL
https://posthog.yourcompany.com
```
2. **Configure Connection**
```json theme={"system"}
{
"type": "posthog",
"host": "posthog.yourcompany.com",
"port": "443",
"username": "phc_your_project_api_key_here",
"database": "12345"
}
```
### Query Types
The PostHog integration supports three types of queries:
#### 1. HogQL Queries (Recommended)
PostHog's SQL dialect for querying event data:
```sql theme={"system"}
SELECT event, properties.$browser, count()
FROM events
WHERE timestamp > '2024-01-01'
AND event = 'page_view'
GROUP BY event, properties.$browser
ORDER BY count() DESC;
```
#### 2. REST API Calls
Direct API endpoint calls:
```bash theme={"system"}
# Get events
GET /api/projects/:project_id/events
# Get insights
GET /api/projects/:project_id/insights
# Get persons
GET /api/projects/:project_id/persons
```
#### 3. Query API Calls
Structured query requests:
```json theme={"system"}
QUERY {
"kind": "EventsQuery",
"select": ["event", "timestamp", "properties"],
"where": ["event", "=", "page_view"],
"limit": 100
}
```
### HogQL Reference
HogQL is PostHog's SQL dialect optimized for event analytics.
#### Basic Syntax
```sql theme={"system"}
SELECT columns
FROM events | persons | sessions | recordings
WHERE conditions
GROUP BY columns
ORDER BY columns
LIMIT number
```
#### Key Tables
| Table | Description |
| ------------ | ----------------------------------- |
| `events` | All tracked events with properties |
| `persons` | User/person records with properties |
| `sessions` | Session-level data |
| `recordings` | Session recording metadata |
#### Common Columns
**Events Table**
```sql theme={"system"}
-- Core event fields
SELECT
event, -- Event name
timestamp, -- When the event occurred
distinct_id, -- User identifier
uuid, -- Unique event ID
properties, -- Event properties (JSON)
person_id -- Person UUID
FROM events;
```
**Event Properties**
```sql theme={"system"}
-- Access event properties
SELECT
event,
properties.$browser, -- Browser name
properties.$current_url, -- Current URL
properties.$lib, -- Library used
properties.$os, -- Operating system
properties.custom_property -- Custom properties
FROM events;
```
**Person Properties**
```sql theme={"system"}
-- Access person properties
SELECT
distinct_id,
properties.email,
properties.name,
properties.$initial_browser,
properties.$initial_current_url
FROM persons;
```
#### Date/Time Functions
```sql theme={"system"}
-- Date filtering
WHERE timestamp > '2024-01-01'
WHERE timestamp >= now() - interval 7 day
WHERE timestamp between '2024-01-01' and '2024-01-31'
-- Date formatting
SELECT
toDate(timestamp) as date,
toStartOfWeek(timestamp) as week,
toStartOfMonth(timestamp) as month
FROM events;
```
#### Aggregation Functions
```sql theme={"system"}
-- Counting
SELECT count() as total_events
SELECT count(distinct distinct_id) as unique_users
SELECT countIf(event = 'purchase') as purchases
-- Statistical functions
SELECT
avg(properties.session_duration) as avg_duration,
median(properties.session_duration) as median_duration,
percentile(properties.session_duration, 0.95) as p95_duration
FROM events;
```
### REST API Usage
#### Event Queries
```bash theme={"system"}
# Get recent events
GET /api/projects/:project_id/events?limit=100
# Filter events by name
GET /api/projects/:project_id/events?event=page_view
# Filter by date range
GET /api/projects/:project_id/events?after=2024-01-01&before=2024-01-31
```
#### Insights API
```bash theme={"system"}
# Get existing insights
GET /api/projects/:project_id/insights
# Get specific insight
GET /api/projects/:project_id/insights/123
# Create new insight
POST /api/projects/:project_id/insights
{
"name": "Page Views This Week",
"filters": {
"events": [{"id": "page_view"}],
"date_from": "-7d"
}
}
```
#### Persons API
```bash theme={"system"}
# Get persons
GET /api/projects/:project_id/persons
# Search persons
GET /api/projects/:project_id/persons?search=user@example.com
# Get person by ID
GET /api/projects/:project_id/persons/distinct_id
```
### Query API Usage
The Query API provides structured querying capabilities.
#### Events Query
```json theme={"system"}
QUERY {
"kind": "EventsQuery",
"select": [
"event",
"timestamp",
"properties.$browser",
"properties.custom_field"
],
"where": [
"and",
["event", "=", "page_view"],
["timestamp", ">", "2024-01-01"]
],
"orderBy": ["timestamp desc"],
"limit": 100
}
```
#### Trends Query
```json theme={"system"}
QUERY {
"kind": "TrendsQuery",
"series": [
{
"event": "page_view",
"name": "Page Views"
}
],
"dateRange": {
"date_from": "-30d",
"date_to": null
},
"interval": "day"
}
```
#### Funnel Query
```json theme={"system"}
QUERY {
"kind": "FunnelsQuery",
"series": [
{"event": "page_view", "name": "Page View"},
{"event": "sign_up", "name": "Sign Up"},
{"event": "purchase", "name": "Purchase"}
],
"dateRange": {
"date_from": "-30d"
}
}
```
### Query Examples
#### Event Analytics
```sql theme={"system"}
-- Most popular events
SELECT event, count() as event_count
FROM events
WHERE timestamp > now() - interval 30 day
GROUP BY event
ORDER BY event_count DESC
LIMIT 20;
-- Events by hour of day
SELECT
toHour(timestamp) as hour,
count() as events
FROM events
WHERE timestamp > now() - interval 7 day
GROUP BY hour
ORDER BY hour;
-- Top pages viewed
SELECT
properties.$current_url as page,
count() as page_views,
count(distinct distinct_id) as unique_visitors
FROM events
WHERE event = 'page_view'
AND timestamp > now() - interval 7 day
GROUP BY properties.$current_url
ORDER BY page_views DESC
LIMIT 10;
```
#### User Analytics
```sql theme={"system"}
-- Daily active users
SELECT
toDate(timestamp) as date,
count(distinct distinct_id) as daily_active_users
FROM events
WHERE timestamp > now() - interval 30 day
GROUP BY date
ORDER BY date;
-- User retention by signup date
SELECT
toStartOfWeek(first_seen) as signup_week,
count(distinct distinct_id) as signed_up,
countIf(last_seen > first_seen + interval 7 day) as retained_week1,
countIf(last_seen > first_seen + interval 30 day) as retained_month1
FROM (
SELECT
distinct_id,
min(timestamp) as first_seen,
max(timestamp) as last_seen
FROM events
GROUP BY distinct_id
)
GROUP BY signup_week
ORDER BY signup_week;
```
#### Product Analytics
```sql theme={"system"}
-- Feature usage analysis
SELECT
properties.feature_name,
count() as usage_count,
count(distinct distinct_id) as unique_users
FROM events
WHERE event = 'feature_used'
AND timestamp > now() - interval 30 day
GROUP BY properties.feature_name
ORDER BY usage_count DESC;
-- Session duration analysis
SELECT
properties.$browser,
avg(properties.session_duration) as avg_duration,
median(properties.session_duration) as median_duration,
count(distinct distinct_id) as users
FROM events
WHERE event = 'session_end'
AND timestamp > now() - interval 7 day
GROUP BY properties.$browser
ORDER BY avg_duration DESC;
-- Conversion funnel
SELECT
step,
count(distinct user_id) as users,
count(distinct user_id) * 100.0 / first_value(count(distinct user_id)) OVER (ORDER BY step) as conversion_rate
FROM (
SELECT distinct_id as user_id, 1 as step FROM events WHERE event = 'page_view' AND timestamp > now() - interval 30 day
UNION ALL
SELECT distinct_id as user_id, 2 as step FROM events WHERE event = 'sign_up' AND timestamp > now() - interval 30 day
UNION ALL
SELECT distinct_id as user_id, 3 as step FROM events WHERE event = 'purchase' AND timestamp > now() - interval 30 day
)
GROUP BY step
ORDER BY step;
```
#### Performance Analytics
```sql theme={"system"}
-- Page load times
SELECT
properties.$current_url as page,
avg(properties.load_time) as avg_load_time,
percentile(properties.load_time, 0.95) as p95_load_time,
count() as page_loads
FROM events
WHERE event = 'page_load'
AND timestamp > now() - interval 7 day
AND properties.load_time > 0
GROUP BY properties.$current_url
ORDER BY avg_load_time DESC
LIMIT 20;
-- Error tracking
SELECT
properties.error_type,
properties.error_message,
count() as error_count,
count(distinct distinct_id) as affected_users
FROM events
WHERE event = 'error'
AND timestamp > now() - interval 24 hour
GROUP BY properties.error_type, properties.error_message
ORDER BY error_count DESC;
```
#### Marketing Analytics
```sql theme={"system"}
-- Traffic sources
SELECT
properties.$referring_domain as source,
count() as visits,
count(distinct distinct_id) as unique_visitors,
countIf(event = 'sign_up') as conversions
FROM events
WHERE event = 'page_view'
AND timestamp > now() - interval 30 day
GROUP BY properties.$referring_domain
ORDER BY visits DESC;
-- Campaign performance
SELECT
properties.utm_campaign,
properties.utm_source,
properties.utm_medium,
count(distinct distinct_id) as visitors,
countIf(event = 'purchase') as purchases,
sum(properties.revenue) as total_revenue
FROM events
WHERE timestamp > now() - interval 30 day
AND properties.utm_campaign IS NOT NULL
GROUP BY properties.utm_campaign, properties.utm_source, properties.utm_medium
ORDER BY total_revenue DESC;
```
#### REST API Examples
```bash theme={"system"}
# Get events for specific user
GET /api/projects/:project_id/events?distinct_id=user123
# Get insights with filters
GET /api/projects/:project_id/insights?filter=events&events=[{"id":"page_view"}]
# Export events as CSV
GET /api/projects/:project_id/events/export?format=csv&after=2024-01-01
# Get cohorts
GET /api/projects/:project_id/cohorts
# Get feature flags
GET /api/projects/:project_id/feature_flags
```
#### Query API Examples
```json theme={"system"}
// User path analysis
QUERY {
"kind": "PathsQuery",
"dateRange": {"date_from": "-7d"},
"pathsFilter": {
"include_event_types": ["$pageview"],
"start_point": "/home"
}
}
// Session recording query
QUERY {
"kind": "SessionsTimelineQuery",
"dateRange": {"date_from": "-24h"},
"events": [
{"event": "error", "properties": {"error_type": "javascript"}}
]
}
// Property analysis
QUERY {
"kind": "EventsQuery",
"select": [
"properties.$browser",
"count()"
],
"where": [
"and",
["event", "=", "page_view"],
["timestamp", ">", "-7d"]
],
"groupBy": ["properties.$browser"]
}
```
### Best Practices
#### 1. Query Performance
```sql theme={"system"}
-- ✅ Good: Use specific date ranges
WHERE timestamp > now() - interval 7 day
-- ✅ Good: Filter early and be specific
WHERE event = 'page_view'
AND timestamp > '2024-01-01'
AND properties.$current_url LIKE '/product%'
-- ✅ Good: Limit large result sets
LIMIT 1000
-- ❌ Avoid: Querying all historical data
WHERE timestamp > '2020-01-01' -- Too broad
```
#### 2. Property Access
```sql theme={"system"}
-- ✅ Good: Use specific property names
SELECT properties.$browser, properties.custom_field
-- ✅ Good: Check for property existence
WHERE properties.email IS NOT NULL
-- ✅ Good: Use proper property types
WHERE toFloat64(properties.price) > 100
```
#### 3. Aggregations
```sql theme={"system"}
-- ✅ Good: Use appropriate aggregation functions
SELECT
count() as total_events,
count(distinct distinct_id) as unique_users,
avg(properties.session_duration) as avg_duration
-- ✅ Good: Group by meaningful dimensions
GROUP BY event, properties.$browser, toDate(timestamp)
```
#### 4. API Usage
```bash theme={"system"}
# ✅ Good: Use pagination for large datasets
GET /api/projects/:project_id/events?limit=100&offset=100
# ✅ Good: Filter at the API level
GET /api/projects/:project_id/events?event=page_view&after=2024-01-01
# ✅ Good: Use appropriate content types
Content-Type: application/json
Authorization: Bearer your_api_key
```
#### 5. Error Handling
```sql theme={"system"}
-- ✅ Good: Handle potential null values
WHERE properties.email IS NOT NULL AND properties.email != ''
-- ✅ Good: Use safe type conversions
WHERE toFloat64OrNull(properties.price) > 0
-- ✅ Good: Validate data before aggregating
WHERE timestamp > '2020-01-01' AND timestamp < now()
```
### Troubleshooting
#### Common Errors
**1. "Invalid API Key"**
```json theme={"system"}
{
"error": "HTTP 401: {\"type\":\"authentication_error\",\"code\":\"invalid_api_key\"}"
}
```
**Solution**: Verify your Project API Key is correct and has proper permissions.
**2. "Project not found"**
```json theme={"system"}
{
"error": "HTTP 404: Project not found"
}
```
**Solution**: Check that your Project ID is correct and accessible with your API key.
**3. "HogQL syntax error"**
```sql theme={"system"}
-- ❌ Error: Invalid HogQL syntax
SELECT * FROM events WHERE timestamp > invalid_date
-- ✅ Fix: Use proper date format
SELECT * FROM events WHERE timestamp > '2024-01-01'
```
**4. "Property not found"**
```sql theme={"system"}
-- ❌ Error: Property doesn't exist
SELECT properties.nonexistent_field FROM events
-- ✅ Fix: Check property exists first
SELECT properties.nonexistent_field FROM events
WHERE properties.nonexistent_field IS NOT NULL
```
#### Debugging Tips
1. **Start Simple**: Begin with basic queries and add complexity gradually
2. **Check Date Ranges**: Ensure your date filters return data
3. **Validate Properties**: Use `DESCRIBE events` to see available properties
4. **Test with Limits**: Use `LIMIT 10` for initial testing
5. **Check API Responses**: Look at raw JSON responses for debugging
#### Performance Optimization
1. **Use Specific Date Ranges** to reduce data scanned
2. **Filter Early** with WHERE clauses before aggregation
3. **Limit Results** with LIMIT clauses
4. **Index on Properties** that you query frequently
5. **Use Sampling** for large datasets when approximate results are acceptable
#### Connection Issues
```bash theme={"system"}
# Test connection
curl -H "Authorization: Bearer your_api_key" \
https://app.posthog.com/api/projects/your_project_id/
# Verify API key format
# Should start with 'phc_' for project API keys
phc_abcdef1234567890...
# Check project ID is numeric
12345 # ✅ Correct
project_name # ❌ Incorrect
```
### Advanced Usage
#### Custom Event Properties
```sql theme={"system"}
-- Track custom business metrics
SELECT
properties.plan_type,
count(distinct distinct_id) as customers,
sum(toFloat64(properties.monthly_revenue)) as total_revenue,
avg(toFloat64(properties.monthly_revenue)) as avg_revenue_per_customer
FROM events
WHERE event = 'subscription_created'
AND timestamp > now() - interval 30 day
GROUP BY properties.plan_type
ORDER BY total_revenue DESC;
```
#### Cohort Analysis
```sql theme={"system"}
-- Monthly cohort retention
WITH cohorts AS (
SELECT
distinct_id,
toStartOfMonth(min(timestamp)) as cohort_month
FROM events
WHERE event = 'sign_up'
GROUP BY distinct_id
),
monthly_activity AS (
SELECT
distinct_id,
toStartOfMonth(timestamp) as activity_month
FROM events
WHERE event = 'page_view'
GROUP BY distinct_id, activity_month
)
SELECT
cohort_month,
count(distinct c.distinct_id) as cohort_size,
count(distinct ma.distinct_id) as retained_users,
count(distinct ma.distinct_id) * 100.0 / count(distinct c.distinct_id) as retention_rate
FROM cohorts c
LEFT JOIN monthly_activity ma ON c.distinct_id = ma.distinct_id
AND ma.activity_month = cohort_month + interval 1 month
GROUP BY cohort_month
ORDER BY cohort_month;
```
#### Real-time Dashboards
```sql theme={"system"}
-- Live event stream (last 5 minutes)
SELECT
timestamp,
event,
distinct_id,
properties.$current_url
FROM events
WHERE timestamp > now() - interval 5 minute
ORDER BY timestamp DESC
LIMIT 100;
-- Current active users (last 5 minutes)
SELECT count(distinct distinct_id) as current_active_users
FROM events
WHERE timestamp > now() - interval 5 minute;
```
***
### Getting Help
* **PostHog Documentation**: [PostHog Docs](https://posthog.com/docs)
* **HogQL Reference**: [HogQL Guide](https://posthog.com/docs/hogql)
* **API Reference**: [PostHog API Docs](https://posthog.com/docs/api)
* **Community**: [PostHog Slack](https://posthog.com/slack)
Start analyzing your product data with SyneHQ today! 🦔✨
# Examples
Source: https://docs.synehq.com/features/tangent-lake/examples
Ready-to-run SQL for cross-database analytics
## Compare users and orders (Postgres + MySQL)
```sql theme={"system"}
SELECT u.id, u.name, SUM(o.amount) AS revenue
FROM postgres_db.public.users u
JOIN mysql_db.sales.orders o ON u.id = o.user_id
GROUP BY u.id, u.name
ORDER BY revenue DESC
LIMIT 10;
```
## Time-windowed metrics
```sql theme={"system"}
SELECT DATE_TRUNC('month', o.created_at) AS month, SUM(o.amount) AS revenue
FROM mysql_db.sales.orders o
GROUP BY month
ORDER BY month;
```
## Bring in a CSV alongside a database
```sql theme={"system"}
SELECT u.email, c.last_login
FROM postgres_db.public.users u
JOIN read_csv_auto('https://example.com/logins.csv') c
ON u.email = c.email;
```
DuckDB can read CSV/JSON/Parquet directly via HTTP/S3—handy for temporary joins without loading data.
## Materialize a subset into DuckDB
```sql theme={"system"}
CREATE TABLE top_customers AS
SELECT u.id, u.name, SUM(o.amount) AS revenue
FROM postgres_db.public.users u
JOIN mysql_db.sales.orders o ON u.id = o.user_id
GROUP BY u.id, u.name
ORDER BY revenue DESC
LIMIT 100;
```
Materialization is optional; most queries can run fully federated without persisting.
# FAQ
Source: https://docs.synehq.com/features/tangent-lake/faq
Common questions about Tangent Lake
No. Tangent Lake queries data live from your connected sources. No ETL required.
Any source supported by SyneHQ connections can participate: Postgres, MySQL, SQLite, Mongo (via SQL Bridge), and more. See **Data Sources** for the full list.
Yes. All connections follow SyneHQ’s security model (encryption, RBAC, audit logs). For private networks, use **Local Connections** with the Rabbit tunnel.
For exploration and operational analytics, live federation is often faster to iterate. For heavy recurring jobs, materializing subsets can help.
Yes. DuckDB SQL can copy or create tables across sources when needed—useful for migrations or “pinning” a result set.
# Getting Started
Source: https://docs.synehq.com/features/tangent-lake/getting-started
Create and use your first Tangent
## Create your first Tangent
Navigate to data.synehq.com/tangents.
* Click **Create Tangent**
* Name your Tangent
* Select your database connections
Need to add connections first? Go to Connections and add Postgres/MySQL/etc.
* Open your Tangent card → **Browse & Query**
* Explore tables and relationships across sources
* Open the Query Console to run federated SQL
Use the SQL console to write and run federated queries
## Example: Postgres + MySQL
```sql theme={"system"}
SELECT pg_users.name, mysql_orders.amount
FROM postgres_db.public.users pg_users
JOIN mysql_db.sales.orders mysql_orders
ON pg_users.id = mysql_orders.user_id;
```
This runs live with no ETL—DuckDB orchestrates the query under the hood.
# How It Works
Source: https://docs.synehq.com/features/tangent-lake/how-it-works
DuckDB federation, ATTACH, and orchestration
Tangent Lake uses DuckDB to attach multiple databases in a single session and execute federated SQL across them—securely and on demand.
## DuckDB and ATTACH
DuckDB is an in‑process analytics database optimized for interactive workloads. A key feature used by Tangent Lake is **ATTACH**, which connects DuckDB to multiple sources (Postgres, MySQL, SQLite, DuckDB files, and more).
* Docs: ATTACH statement
* Multi‑database: Multi‑database support
## What this enables
* **Cross‑engine joins**: Join Postgres + MySQL + SQLite in one query
* **Live analytics**: Query without ETL; pull only the data needed
* **Schema discovery**: Fast introspection of tables, columns, relationships
* **On‑the‑fly movement**: Move data across engines with SQL when needed
## Orchestration
Each Tangent is a session. Selected connections are attached for that session, enabling cross‑database access immediately.
DuckDB parses and optimizes your federated SQL, pushes down filters, and only fetches necessary data.
DuckDB’s pluggable extensions connect to Postgres, MySQL, SQLite, JSON/CSV, and cloud storage like S3/HTTPS.
## Example
```sql theme={"system"}
SELECT a.user_id, a.name, SUM(o.amount) AS total
FROM postgres_db.public.users a
JOIN mysql_db.sales.orders o ON a.id = o.user_id
GROUP BY a.user_id, a.name
ORDER BY total DESC;
```
You can explore attached schemas in Browse & Query and switch to the console to see generated SQL.
# Tangent Lake
Source: https://docs.synehq.com/features/tangent-lake/overview
Federated Query Lake
Tangent Lake lets you query across multiple databases through a unified, no‑code experience in SyneHQ. Join, analyze, and visualize data from different sources—without ETL.

## Start here
Create your first Tangent and run a federated SQL query
DuckDB under the hood, ATTACH, and federated orchestration
Ready-to-run SQL examples for cross‑database joins
Common questions, limits, and best practices
Ensure your sources are connected and ready
## Why Tangent Lake
* **No ETL**: Query live data across engines without moving it
* **Cross‑engine joins**: Postgres + MySQL + SQLite + DuckDB files
* **Faster analysis**: One console, one SQL query, unified results
* **Governed access**: Reuse connections with RBAC and auditing
Prefer UI? Use Browse & Query in the console. Prefer code? Use the SQL console to see generated SQL and results side‑by‑side.
# Data Visualization
Source: https://docs.synehq.com/features/visualization
Create interactive charts, dashboards, and visual insights from your data queries with AI-powered analytics
SyneHQ turns your words into stunning dashboards and insights—no coding required. This section covers how to build, interpret, and share powerful data visualizations using SyneHQ’s visual analytics features.
SyneHQ empowers anyone to transform raw data into compelling, interactive charts and dashboards. Whether you ask questions in plain English or use the no-code builder, SyneHQ’s visualization engine translates your intent into actionable analytics that drive decisions.
Main benefits:
* **Instant charting:** Go from question or query to live charts and insights in seconds.
* **Rich outputs:** Visuals include bar charts, line charts, pie charts, tables, and more.
* **Narrative insights:** Each chart comes with automated “takeaway” summaries and context explanations.
* **Dashboarding:** Arrange, organize, and refresh visualizations to monitor key metrics at a glance.
### How to Build Visualizations
1. **Ask or Build a Query**
* Use natural language (“Show me quarterly investment volume”) or the No-Code Query Builder.
* Review or edit generated SQL for full transparency.
2. **Run and Visualize**
* Click **Run** to execute your query.
* Instantly preview results as tables and charts.
3. **Choose and Customize Chart Type**
* Select from bar, line, pie, or table using the Visualization panel on the right.
* Assign **X** (dimension) and **Y** (metric) fields—e.g., Quarter vs. Transaction Count.
4. **Automated Insights & Takeaways**
* Below each chart, view an AI-generated summary interpreting the trend, anomaly, or correlation.
* Examples: “Investment activity peaked in Q3 2017...”, “Largest negative cash flow from bid acceptance...”
5. **Dashboard Mode**
* Click **Add Chart** to organize charts into dashboards.
* Move visualizations onto boards for monitoring by team or use case.
* Use **Refresh All Charts** to update with the latest data.
6. **Export & Share**
* Export visuals and data for use in slides, reports, or discussions.
### Dashboard

### Visualization Types Supported
* **Bar Chart:** Ideal for time series (e.g., quarterly volumes), category comparisons, and ranking.
* **Line Chart:** Perfect for trend analysis or visualizing continuous changes (e.g., cash flow impact over time).
* **Pie Chart:** For proportional breakdowns.
* **Table:** For detailed, granular output.
* **Area Chart:** Great for showing cumulative values and part-to-whole relationships over time.
* **Scatter Plot:** Perfect for correlation analysis and identifying relationships between two variables.
* **Composed Chart:** Combine multiple chart types (bar + line) to show different metrics on the same view.
* **Radar Chart:** Compare multiple variables across categories in a circular format.
* **Treemap:** Visualize hierarchical data with nested rectangles proportional to values.
* **Geographic Charts:** Display data on maps for location-based analysis and regional insights.
* **Sankey Diagram:** Show flow and relationships between different stages or categories.
* **Heatmap:** Reveal patterns and correlations in large datasets through color intensity.
* **Funnel Chart:** Track conversion rates and drop-offs through sequential stages.
* **KPI Cards:** Display key metrics with context, targets, and trend indicators.
* **Box Plot:** Analyze statistical distributions, outliers, and quartile ranges.
* **Flexible switching:** Instantly toggle between chart types. Icon tooltips describe best uses.
Each chart supports direct interaction and board placement.
### Mapbox Support

SyneHQ supports comprehensive geographic visualization capabilities through integration with both ECharts and Mapbox/Deck.GL:
**Map Types Available:**
* **Heatmap:** Color-intensity overlays showing data density and distribution patterns
* **Cluster:** Aggregated point clustering with dynamic zoom-based grouping
* **Scatter:** Individual data points plotted on geographic coordinates
* **Screen Grid:** Hexagonal or square grid aggregation for spatial analysis
* **Path/Flow:** Directional lines showing movement, routes, or connections between locations
* **Country Maps:** Detailed country-level choropleth visualizations
* **World Map:** Global choropleth with country-level data aggregation
**Configuration Requirements:**
* **Latitude/Longitude Fields:** Required for all geographic visualizations
* **Country Selection:** Needed for country-specific map renders
* **Value Mapping:** Assign metric fields to control color intensity, point size, or aggregation values
**Interactive Features:**
* **Dynamic Zoom:** Maps automatically adapt detail level based on zoom
* **Hover Tooltips:** Display data values and location information
* **Layer Toggle:** Switch between different visualization types instantly
* **Export Support:** Save high-resolution map images and underlying data
Geographic charts seamlessly integrate with SyneHQ's dashboard system and support real-time data updates.
* **Natural Language + Visuals:** Start with simple questions—SyneHQ’s AI interprets intent and suggests the best chart.
* **Automated Explanations:** Use narrative takeaways to enhance presentations and drive decisions.
* **Dashboards:** Group essential charts to track KPIs.
* **Organization:** Use categories, search, and pinned boards for fast access.
* **Collaboration:** All boards and charts are easily shareable within your team.
**Quarterly Investment Transaction Volume**
* **Chart:** Vertical bar chart with quarterly time axis.
* **Legend:** Transaction count.
* **Takeaway:** Highlights peaks and declines in investment activity.
* **Usage:** Spot inflection points, market strategy changes.
**Financial Impact by Operation Type**
* **Chart:** Line chart showing cash flow by operation (bid acceptance, loan granted, etc.)
* **Legend:** Total amount.
* **Takeaway:** Identifies the largest positive/negative flows and drivers—e.g., bids, provisions.
**Narrative Example Below Charts:**
> “Investment activity peaked in Q3 2017 (192 transactions)... Activity significantly declined in Q4 2018, indicating a possible shift in investment strategy or market conditions.”
> “The largest negative cash flow comes from bid acceptance (−\$2,984)... This suggests an active strategy of bidding on investments but being selective about which ones move forward.”
**Q: Do I need to know SQL to create charts?**\
No, SyneHQ’s builder and natural language features allow anyone to build and visualize insights. Advanced users can also edit SQL directly.
**Q: How do I organize multiple visualizations?**\
Use **Dashboards** and **Boards** to group, organize, and refresh related charts.
**Q: What if I want to present my findings?**\
Each chart and its narrative can be exported or embedded in presentations, reports, and emails.
**Q: Can charts update with new data?**\
Yes, use **Refresh All Charts** to fetch the latest numbers across your dashboards.
# AI-Powered Features
Source: https://docs.synehq.com/get-started/ai-features
Natural language queries and intelligent data analysis
SyneHQ's AI understands your database schema and provides intelligent assistance for query writing, optimization, and data exploration. Our enterprise-grade AI models deliver accurate, reliable, and contextually aware natural language processing.
## Natural Language Processing
1. **Question Input**: You ask a question in plain English
2. **Intent Recognition**: AI understands what you're looking for
3. **Schema Analysis**: AI examines your database structure
4. **Query Generation**: AI creates the appropriate SQL/NoSQL query
5. **Execution**: Query runs against your database
6. **Results**: You get answers with visualizations
**User**: "Show me our top customers by revenue"
**AI**: *Analyzes customer and order tables, generates SQL query*
**Result**: Table of customers with total revenue, sorted descending
**User**: "Which marketing campaigns are performing best?"
**AI**: *Joins campaign, user, and conversion tables*
**Result**: Chart showing campaign performance metrics
**User**: "What's our monthly growth rate?"
**AI**: *Calculates month-over-month growth from time-series data*
**Result**: Line chart with growth trends and percentage changes
## Smart Features
* **Automatic Discovery**: AI learns your database structure
* **Relationship Mapping**: Understands table relationships and foreign keys
* **Data Type Recognition**: Knows how to handle different data types
* **Business Logic**: Learns your business terminology and metrics
* **Conversation Memory**: Remembers previous questions in the session
* **Follow-up Questions**: "Show me more details" works naturally
* **Query Refinement**: "Filter by last 30 days" modifies previous results
* **Cross-Reference**: Can reference previous results in new queries
* **Performance Analysis**: Suggests faster query approaches
* **Index Recommendations**: Advises on database optimization
* **Query Rewriting**: Automatically optimizes generated queries
* **Resource Management**: Efficient memory and CPU usage
## Query Types Supported
```sql theme={"system"}
-- Natural language: "Show me total sales by month"
SELECT
DATE_TRUNC('month', order_date) as month,
SUM(amount) as total_sales
FROM orders
GROUP BY month
ORDER BY month;
```
```sql theme={"system"}
-- Natural language: "Which products are most popular with premium customers?"
SELECT
p.name,
COUNT(o.id) as order_count
FROM products p
JOIN order_items oi ON p.id = oi.product_id
JOIN orders o ON oi.order_id = o.id
JOIN customers c ON o.customer_id = c.id
WHERE c.tier = 'premium'
GROUP BY p.id, p.name
ORDER BY order_count DESC;
```
```sql theme={"system"}
-- Natural language: "Show me daily active users for the last 30 days"
SELECT
DATE(created_at) as date,
COUNT(DISTINCT user_id) as daily_active_users
FROM user_sessions
WHERE created_at >= NOW() - INTERVAL '30 days'
GROUP BY DATE(created_at)
ORDER BY date;
```
```sql theme={"system"}
-- Natural language: "Compare user data from our main app and mobile app"
SELECT
pg_users.name,
pg_users.email,
mobile_users.last_login
FROM postgres_db.public.users pg_users
JOIN mysql_db.mobile.users mobile_users
ON pg_users.email = mobile_users.email;
```
## AI Capabilities
* **Question Types**: What, how, when, where, why questions
* **Comparative Analysis**: "Better than", "worse than", "compared to"
* **Temporal Queries**: "Last week", "this month", "year over year"
* **Aggregations**: Sum, average, count, percentage, growth rate
* **KPI Calculation**: Revenue, conversion rates, customer lifetime value
* **Trend Analysis**: Growth patterns, seasonality, anomalies
* **Segmentation**: Customer groups, product categories, geographic regions
* **Forecasting**: Simple predictions based on historical data
* **Schema Discovery**: "What tables do we have?"
* **Data Profiling**: "Show me sample data from the users table"
* **Quality Checks**: "Are there any missing values in the orders table?"
* **Relationship Mapping**: "How are customers and orders related?"
## Enterprise AI Features
* **Custom Training**: Train models on your specific business terminology
* **Domain Adaptation**: Adapt AI to your industry-specific language
* **Multi-Language Support**: Support for multiple languages and dialects
* **Context Learning**: AI learns from your team's query patterns
* **Data Privacy**: AI models don't store or learn from sensitive data
* **Audit Trails**: Complete logging of AI-generated queries
* **Approval Workflows**: Optional approval for AI-generated queries
* **Custom Security**: Integrate with your security and compliance systems
* **Model Optimization**: Optimized for enterprise-scale workloads
* **Caching**: Intelligent caching of AI model responses
* **Load Balancing**: Distributed AI processing across multiple instances
* **Resource Management**: Efficient GPU and memory utilization
## Learning & Improvement
* **User Feedback**: Learns from your corrections and preferences
* **Query History**: Improves based on successful query patterns
* **Schema Changes**: Automatically adapts to database modifications
* **Business Context**: Understands your industry-specific terminology
* **Model Updates**: Regular AI model improvements
* **Feature Enhancements**: New query capabilities added over time
* **Performance Optimization**: Faster and more accurate query generation
* **Language Support**: Additional languages and dialects
## Best Practices
* **Be Specific**: "Show me sales from Q1" vs "Show me sales"
* **Use Business Terms**: "Premium customers" vs "customers with tier = 'premium'"
* **Provide Context**: "Compared to last year" vs just "growth"
* **Ask Follow-ups**: "Show me more details" or "Break this down by region"
* **Start Simple**: Begin with basic questions, then add complexity
* **Use Natural Language**: Don't try to write SQL-like queries
* **Provide Feedback**: Correct the AI when it makes mistakes
* **Explore Gradually**: Build up to complex multi-table analysis
## Limitations & Considerations
While SyneHQ's AI is powerful, understanding its limitations helps you use it most effectively.
* **Complex Business Logic**: Very specific business rules may need manual queries
* **Custom Functions**: Database-specific functions may not be supported
* **Performance Tuning**: Very large datasets may need optimization
* **Real-time Data**: Some real-time features may have slight delays
* **Highly Optimized Queries**: When performance is critical
* **Custom Aggregations**: Complex business calculations
* **Database-Specific Features**: Using database-specific functions
* **Debugging**: When you need to see the exact SQL being generated
## Getting Started
Ready to start using AI features? Follow these steps to get the most out of natural language querying.
1. **Connect your database** (if not already done)
2. **Ask a simple question**: "Show me total sales"
3. **Review the results**: Check if the answer makes sense
4. **Ask follow-ups**: "Break this down by month"
5. **Explore further**: "Which products are selling best?"
* **Start with familiar data**: Query tables you understand well
* **Use business language**: Speak naturally, not technically
* **Be patient**: AI improves with more usage and feedback
* **Ask for help**: Use the "Explain this query" feature to learn
## Enterprise AI Support
For enterprise customers, we offer custom AI model training and specialized support for your specific business needs.
Train AI models on your specific business terminology and data patterns for enhanced accuracy and relevance.
* **Query Optimization**: Expert guidance on writing effective natural language queries
* **Schema Optimization**: Optimize your database schema for better AI understanding
* **Business Logic**: Help AI understand your specific business rules and KPIs
* **Team Training**: Train your team on effective AI usage
See more examples of natural language queries
Learn how to write better natural language queries
Custom AI training and enterprise features
# Platform Architecture
Source: https://docs.synehq.com/get-started/architecture
Technical architecture and core components of SyneHQ
SyneHQ is engineered for both cloud-hosted SaaS and enterprise self-hosted deployments with the same core architecture and security model.
SyneHQ is built on a modern, scalable architecture designed to handle enterprise-grade data analytics workloads while maintaining the simplicity of natural language interaction. Our platform is engineered for both cloud-hosted SaaS and enterprise self-hosted deployments.
### Core Components
| Component | Purpose |
| -------------------- | -------------------------------------------------------------- |
| Query Engine | DuckDB-powered federated analytics across sources |
| AI Layer | Natural language understanding, query generation, optimization |
| Connector Framework | Universal connectivity to SQL/NoSQL/analytic systems |
| Security Layer | Zero‑trust, encryption, RBAC, audit logging |
| Visualization Engine | Charts, dashboards, sharing, export |
## System Architecture
```mermaid theme={"system"}
flowchart TB
subgraph SyneHQ["SyneHQ Platform"]
direction TB
subgraph Presentation["Presentation Layer"]
WebUI["Web UI"]
Mobile["Mobile App"]
API["API Layer"]
end
subgraph Application["Application Layer"]
Query["Query Engine"]
AI["AI/ML Engine"]
Security["Security Layer"]
end
subgraph Data["Data Layer"]
Connectors["Database Connectors"]
Cache["Cache Layer"]
Logging["Logging & Audit"]
end
end
WebUI --> Query
Mobile --> Query
API --> Query
Query --> Connectors
AI --> Connectors
Security --> Logging
Cache --> Connectors
```
## Architecture at a glance (TANGENT LAKE)
```mermaid theme={"system"}
flowchart LR
subgraph Sources["Data Sources"]
A[Postgres]
B[MySQL]
C[Mongo / Files]
Z[many more datasources]
end
subgraph Federation["Tangent Lake (Federation)"]
TL["DuckDB Session
(ATTACH, Orchestration)"]
end
subgraph Explore["Explore & Query"]
Q[Console / SQL]
AI[AI NLQ]
end
subgraph Outcomes["Outcomes"]
D[Dashboards]
E[Alerts]
F[Sharing / RBAC]
end
A --> TL
B --> TL
C --> TL
Z --> TL
TL --> Q
TL --> AI
Q --> D
Q --> E
AI --> D
AI --> E
D --> F
E --> F
```
## Architecture at a glance (DASHBOARDS + CHAT)
```mermaid theme={"system"}
flowchart LR
%% --- Data Sources ---
subgraph Sources["Data Sources"]
A["Postgres"]
B["MySQL"]
C["Mongo"]
R["REST / CSV"]
end
%% --- Connectors ---
subgraph Connect["Connectors"]
PG["PG Connector"]
MY["MySQL Connector"]
MG["Mongo Bridge"]
RS["HTTP / File Reader"]
end
%% --- Application ---
subgraph App["SyneHQ App"]
QE["Query Engine"]
CH["Chat Assistant (NLQ)"]
DB["Dashboard"]
subgraph Charts["Charts on one dashboard"]
X1["Chart: Postgres metric"]
X2["Chart: MySQL metric"]
X3["Chart: Mongo metric"]
end
end
%% --- Edges ---
A --> PG --> QE
B --> MY --> QE
C --> MG --> QE
R --> RS --> QE
CH --> QE
QE --> X1 & X2 & X3
X1 & X2 & X3 --> DB
```
## Component Details
* **Federated Analytics**: Cross-database query execution (TangentLake -> DuckDB)
* **Query Optimization**: Automatic performance tuning
* **Type System**: Universal data type handling
* **Memory Management**: Efficient resource utilization
* **Natural Language Processing**: Converts questions to queries
* **Schema Understanding**: Analyzes database structure
* **Context Management**: Maintains conversation state
* **Learning System**: Improves with user interactions
* **Universal Connectivity**: 20+ database types supported
* **Protocol Support**: SQL, NoSQL, and API connections
* **Authentication**: Secure credential management
* **Connection Pooling**: Efficient resource sharing
* **Zero Trust**: No implicit trust assumptions
* **Encryption**: End-to-end data protection
* **Access Control**: Role-based permissions
* **Audit Logging**: Comprehensive activity tracking
## Data Flow
1. **Natural Language Input**: User asks question in plain English
2. **AI Processing**: Language model converts to query intent
3. **Schema Analysis**: AI understands database structure
4. **Query Generation**: SQL/NoSQL query created
5. **Execution**: Query runs against target database
6. **Result Processing**: Data formatted and visualized
7. **Response**: Results returned to user
1. **Authentication**: User credentials verified
2. **Authorization**: Permissions checked for data access
3. **Query Validation**: Query analyzed for security risks
4. **Execution**: Query runs in user's environment
5. **Audit Logging**: All activities recorded
6. **Response**: Results encrypted and returned
## Scalability Features
### Horizontal Scaling
* **Load Balancing**: Intelligent query distribution
* **Multi-Instance**: Support for multiple SyneHQ instances
* **Database Sharding**: Automatic query routing
* **Resource Management**: Dynamic resource allocation
### Performance Optimization
* **Query Caching**: Intelligent result caching
* **Connection Pooling**: Efficient database connections
* **Memory Management**: Optimized memory usage
* **Index Recommendations**: Database optimization guidance
## Technology Stack
### Core Technologies
| Area | Technologies |
| -------------------- | ---------------------------------------------- |
| Backend | Node.js/TypeScript, Rust, Go Lang, Python |
| Database Engine (Go) | DuckDB for federated analytics |
| AI/ML | GPT-5, Claude, Fine-tuned models |
| Security | End-to-end encryption, Zero-trust architecture |
### Infrastructure
* **Containerization**: Docker for deployment
* **Orchestration**: Kubernetes support
* **Monitoring**: Prometheus and Grafana
* **Logging**: Structured logging with ELK stack
## Enterprise Features
### Multi-Tenancy
| Capability | Description |
| --------------------- | ------------------------------------------- |
| Isolated Environments | Complete data and user isolation per tenant |
| Custom Branding | White-label themes and assets |
| Resource Limits | Configurable limits per tenant/workspace |
| Usage Analytics | Detailed usage tracking and billing exports |
### High Availability
| Capability | Description |
| ----------------- | ---------------------------------------------- |
| Auto-Scaling | Scale compute automatically based on demand |
| Failover | Automatic failover to backup instances |
| Backup & Recovery | Scheduled backups and point‑in‑time recovery |
| Monitoring | Real-time health checks, metrics, and alerting |
### Compliance & Security
| Standard/Control | Coverage |
| -------------------- | ----------------------------------------------- |
| SOC2 Type II | Certified security controls and processes |
| GDPR | Data privacy, subject rights, residency options |
| HIPAA (Enterprise) | PHI handling and administrative controls |
| PCI DSS (Enterprise) | Secure handling of payment-related data |
Learn how to deploy SyneHQ in your environment
Optimize SyneHQ for your workload
Configure security settings and compliance
# Supported Data Sources
Source: https://docs.synehq.com/get-started/data-sources
Connect to 20+ databases and analytics platforms
SyneHQ supports **20+ data sources** through native connectors and protocols, enabling you to query across your entire data ecosystem without complex ETL processes. Our enterprise-grade connectors provide reliable, secure, and high-performance connectivity.
## Universal Data Connectivity
### PostgreSQL Family
* **PostgreSQL** (versions 9.6+)
* **Neon** (serverless PostgreSQL)
* **Supabase** (PostgreSQL with real-time features)
* **AWS RDS PostgreSQL**
* **Google Cloud SQL PostgreSQL**
* **Azure Database for PostgreSQL**
### MySQL Family
* **MySQL** (versions 5.7+)
* **MariaDB** (MySQL-compatible)
* **PlanetScale** (serverless MySQL)
* **AWS RDS MySQL**
* **Google Cloud SQL MySQL**
* **Azure Database for MySQL**
### Enterprise Databases
* **Microsoft SQL Server** (2016+)
* **Oracle Database** (12c+)
* **Oracle Cloud Autonomous Database**
* **IBM Db2** (via SQL connector)
### Cloud Data Warehouses
* **Amazon Redshift**
* **Snowflake** (via SQL connector)
* **Google BigQuery** (via SQL connector)
* **Azure Synapse Analytics**
* **Databricks SQL**
### Analytics Databases
* **ClickHouse** (including ClickHouse Cloud)
* **Apache Druid**
* **Apache Pinot**
### MongoDB
* **MongoDB Atlas** (cloud-hosted)
* **Self-hosted MongoDB** (4.0+)
* **MongoDB with SQL Bridge**: Query MongoDB using SQL syntax
* **Native Mongosh Support**: Use MongoDB's native query language
### Document Stores
* **CouchDB**
* **RethinkDB** (via SQL connector)
### Web Analytics
* **Google Analytics 4** (via GA4 API)
* **Mixpanel** (event analytics)
* **PostHog** (product analytics)
### Business Intelligence
* **Tableau** (via data connector)
* **Power BI** (via data connector)
* **Looker** (via data connector)
### Self-Hosted Databases
* **Local PostgreSQL/MySQL instances**
* **Docker containerized databases**
* **Kubernetes cluster databases**
* **On-premise enterprise databases**
### Secure Connections
* **SSH Tunneling**: Connect to databases behind firewalls
* **VPN Integration**: Secure network connections
* **Rabbit CLI Tunnel**: Secure tunnel client for local connections
* **Reverse Proxy**: Custom proxy configurations
## Connection Methods
```
Database Type: PostgreSQL
Host: your-db.example.com
Port: 5432
Database: analytics
Username: synehq_user
Password: [encrypted]
```
```
postgresql://username:password@host:port/database
mysql://username:password@host:port/database
mongodb://username:password@host:port/database
```
## Connection Security
* **Username/Password**: Traditional database authentication
* **SSL/TLS**: Encrypted connections
* **SSH Keys**: Key-based authentication
* **OAuth**: Cloud provider authentication
* **Service Accounts**: Cloud platform service accounts
* **Connection Encryption**: All connections encrypted in transit
* **Credential Management**: Secure credential storage
* **Connection Pooling**: Efficient resource management
* **Query Logging**: Audit trail for all queries
## Performance Considerations
* **Maximum Connections**: Configurable per database
* **Connection Timeout**: Automatic timeout handling
* **Retry Logic**: Automatic connection retry
* **Load Balancing**: Multiple connection support
* **Query Analysis**: Automatic performance profiling
* **Index Recommendations**: Database optimization guidance
* **Connection Monitoring**: Real-time connection health
* **Resource Management**: Efficient resource utilization
## Getting Started
Ready to connect your first data source? Follow these steps to get up and running quickly.
1. **Choose your database type** from the supported list
2. **Gather connection details** (host, port, credentials)
3. **Test the connection** using SyneHQ's connection tester
4. **Configure permissions** for the SyneHQ user
5. **Start querying** with natural language
* **Network Issues**: Check firewall and network connectivity
* **Authentication**: Verify credentials and permissions
* **SSL/TLS**: Ensure proper certificate configuration
* **Performance**: Monitor connection pool and query performance
Step-by-step connection instructions for each database type
Secure your database connections properly
Optimize connection performance for your workload
## Enterprise Support
For enterprise customers, we offer custom connectors and professional services to ensure seamless integration with your data infrastructure.
For enterprise customers, we can build custom connectors for proprietary or specialized databases. Our engineering team works directly with you to ensure seamless integration.
If your database isn't in our supported list, we can often add support quickly. Contact our enterprise team with your database details for custom development.
* **Database Migration**: Assistance with data source setup
* **Performance Optimization**: Database tuning and optimization
* **Security Audits**: Connection security reviews
* **Training**: Team training on data connectivity
Get help with database connections and enterprise features
# Deployment Options
Source: https://docs.synehq.com/get-started/deployment
Deploy SyneHQ in cloud, self-hosted, or hybrid environments
SyneHQ offers flexible deployment options to meet your organization's needs, from quick cloud setup to complete infrastructure control. Our enterprise-grade platform is designed for both managed SaaS and self-hosted deployments.
## Cloud-Hosted (SaaS)
### Overview
The fastest way to get started with SyneHQ. We manage the infrastructure while you focus on your data.
```
┌─────────────────┐ ┌─────────────────┐ ┌─────────────────┐
│ SyneHQ Web │ │ SyneHQ API │ │ Your Database │
│ Application │◄──►│ Layer │◄──►│ Infrastructure │
└─────────────────┘ └─────────────────┘ └─────────────────┘
```
* **Fastest Time-to-Value**: Start querying in minutes
* **Managed Infrastructure**: Automatic updates and maintenance
* **Built-in Scalability**: Handles traffic spikes automatically
* **Global CDN**: Fast access from anywhere in the world
* **Automatic Backups**: Daily backups with disaster recovery
* **Security Compliance**: SOC2, GDPR, and enterprise security
* **Starter**: \$29/user/month - Perfect for small teams
* **Professional**: \$79/user/month - Advanced features for growing companies
* **Enterprise**: Custom pricing - Full control and compliance
1. **Sign Up**: Create account at synehq.com
2. **Connect Database**: Add your first data source (2 minutes)
3. **Start Querying**: Begin with natural language questions
4. **Invite Team**: Add team members with role-based permissions
## Self-Hosted (Enterprise)
Self-hosting is an enterprise feature. For architecture reviews, sizing guidance, and assisted rollout, contact our team.
Talk to sales/engineering about enterprise self‑hosting
## Hybrid Deployment
### Overview
Combine cloud convenience with local data control. Use SyneHQ cloud with secure tunneling to local databases.
```
┌─────────────────┐ ┌─────────────────┐ ┌─────────────────┐
│ SyneHQ Cloud │ │ Secure Tunnel │ │ Local Database │
│ Application │◄──►│ (Rabbit CLI) │◄──►│ Infrastructure │
└─────────────────┘ └─────────────────┘ └─────────────────┘
```
* **Cloud Convenience**: Managed infrastructure and updates
* **Local Data Control**: Sensitive data stays on-premise
* **Secure Tunneling**: Encrypted connections to local databases
* **Flexible Deployment**: Mix cloud and local data sources
* **Compliance Ready**: Meet data residency requirements
1. **Install Rabbit CLI**: Download and install the tunnel client
2. **Configure Tunnel**: Set up secure connection to local database
3. **Connect Cloud**: Add tunneled database to SyneHQ cloud
4. **Start Querying**: Query local data through cloud interface
### Rabbit CLI Installation
```bash theme={"system"}
# macOS
brew install synehq/rabbit/rabbit
# Linux
curl -fsSL https://get.rabbit.synehq.com | sh
# Windows
# Download from https://get.rabbit.synehq.com/
```
### Tunnel Configuration
```bash theme={"system"}
# Create tunnel to local PostgreSQL
rabbit tunnel create postgresql \
--name local-db \
--host localhost \
--port 5432 \
--database analytics
# Start the tunnel
rabbit tunnel start local-db
```
* **Firewall Rules**: Restrict access to SyneHQ ports
* **VPN Access**: Require VPN for remote access
* **Load Balancer**: Use HTTPS termination and SSL certificates
* **Rate Limiting**: Prevent abuse and DDoS attacks
* **Encryption at Rest**: Encrypt database and file storage
* **Encryption in Transit**: Use TLS for all connections
* **Access Controls**: Implement role-based permissions
* **Audit Logging**: Track all user activities
* **SOC2**: Security controls and audit trails
* **GDPR**: Data privacy and user consent
* **HIPAA**: Healthcare data protection (enterprise)
* **PCI DSS**: Payment card data security (enterprise)
## Enterprise Deployment Services
* **Architecture Review**: Expert guidance on deployment architecture
* **Security Assessment**: Comprehensive security review and hardening
* **Performance Tuning**: Optimize deployment for your workload
* **Migration Support**: Assistance with deployment migration
* **Custom Integrations**: Build custom integrations with your systems
* **White-labeling**: Custom branding and theming
* **API Extensions**: Custom API endpoints and functionality
* **Plugin Development**: Custom plugins and extensions
* **Team Training**: Comprehensive training for your team
* **Documentation**: Custom documentation and runbooks
* **24/7 Support**: Dedicated support for enterprise customers
* **Consulting**: Ongoing consulting and optimization
## Getting Started
### Quick Start (Cloud)
Get started with SyneHQ cloud in 5 minutes
### Self-Hosted Setup (Enterprise)
Discuss enterprise self‑hosting with our team
Security best practices and hardening
## Support
* **Installation Guides**: Step-by-step setup instructions
* **Configuration Reference**: All available options
* **Troubleshooting**: Common issues and solutions
* **API Documentation**: REST API reference
* **Dedicated Support**: Priority support for enterprise customers
* **Custom Deployments**: Assistance with complex setups
* **Training**: Team training and onboarding
* **Consulting**: Architecture and optimization guidance
Get help with enterprise deployment and support
# Welcome to SyneHQ
Source: https://docs.synehq.com/get-started/introduction
Transform how your team works with data - no technical expertise required

## Stop Waiting for Data Answers
Imagine this: It's 3 PM on a Tuesday, and your CEO just asked for last month's conversion rates. Your data team is swamped, and you're staring at a spreadsheet that might as well be written in ancient Greek.
**That's exactly the problem SyneHQ solves.**
We built SyneHQ because we've been there - stuck waiting for data teams, wrestling with complex tools, and missing opportunities because insights were buried in technical complexity.
**"Ask questions in plain English, get answers in seconds"** - That's not a marketing slogan, it's what we actually deliver.
## What Makes SyneHQ Different?
Think of SyneHQ as your team's data translator. We speak both "human" and "database" fluently, so you don't have to.
Remember when you had to wait days for a simple report? Those days are over.
"Show me our top customers" works just as well as complex SQL.
Connect to your current databases - no data migration needed.
From startup to enterprise, we scale with you with enterprise security.
## Real Stories from Real Teams
### Sarah, Marketing Director
*"I used to spend hours building reports in Excel. Now I ask 'What's our best performing campaign?' and get an answer in seconds. My team thinks I'm a data wizard."*
### Mike, Product Manager
*"Our engineering team was always too busy for my data requests. With SyneHQ, I can explore user behavior myself and make decisions faster than ever."*
### Lisa, Finance Controller
*"Compliance reporting used to take weeks. Now I can generate reports on demand and answer auditor questions instantly."*
## What You Can Actually Do
### For Business Teams
* **Marketing**: "Which campaigns are driving the most revenue?"
* **Sales**: "Who are our most likely customers to churn?"
* **Finance**: "What's our cash flow projection for Q3?"
* **Operations**: "Where are our biggest efficiency bottlenecks?"
### For Technical Teams
* **Developers**: Debug data issues without waiting for DBAs
* **Data Engineers**: Focus on building pipelines, not answering ad-hoc questions
* **DevOps**: Monitor system performance in real-time
* **Analysts**: Spend more time on insights, less on query writing
## The Technology (Simplified)
We use AI to understand your questions and translate them into the right database queries. Think of it like having a brilliant data scientist who never sleeps and speaks every database language.
**Your data stays yours** - We never store your data on our servers. Everything runs in your environment.
## Getting Started is Actually Easy
1. **Connect your database** (takes 2 minutes)
2. **Ask your first question** (in plain English)
3. **Get your answer** (with charts and insights)
4. **Share with your team** (one click)
Set up your first connection in under 5 minutes
## Pricing That Makes Sense
### Cloud-Hosted (SaaS)
* **Starter**: \$29/user/month - Perfect for small teams
* **Professional**: \$79/user/month - Advanced features for growing companies
* **Enterprise**: Custom pricing - Full control and compliance
### Self-Hosted (Enterprise)
* **Complete control** over your data and infrastructure
* **Custom security** configurations and compliance
* **Unlimited users** and data volume
* **Dedicated support** and custom integrations
No credit card required, full access for 14 days
See SyneHQ in action with your actual data
## Still Have Questions?
We get it - choosing a data tool is a big decision. Here's what we recommend:
Watch a 5-minute demo with real data
Get personalized answers to your questions
***
**Bottom line**: If you're tired of waiting for data answers, SyneHQ is built for you. No technical expertise required, just ask questions and get insights. Available as a managed SaaS platform or enterprise self-hosted solution.
# Platform Overview
Source: https://docs.synehq.com/get-started/overview
High-level overview of SyneHQ's capabilities and architecture
SyneHQ is an **AI-powered data analytics platform** that transforms how teams work with data. Ask questions in plain English and get instant insights from your databases - no technical expertise required. Available as a managed SaaS platform or enterprise self-hosted solution.
Connect a source and run your first query in minutes

## Core Capabilities
Ask questions like "Show me our top customers" and get SQL automatically generated
Connect to 20+ databases including PostgreSQL, MySQL, MongoDB, and more
Query across multiple databases simultaneously with federated analytics
Zero data footprint - queries run in your environment, data never leaves
## Platform Architecture
SyneHQ is built on modern, scalable technology:
* **Query Engine**: DuckDB-powered federated analytics
* **AI Layer**: Advanced language models for natural language processing
* **Connector Framework**: Universal database connectivity
* **Security Layer**: Zero-trust architecture with end-to-end encryption
Learn about SyneHQ's technical architecture and components
## Supported Data Sources
Connect to your existing databases without any data migration:
### SQL Databases
PostgreSQL, MySQL, SQL Server, Oracle, ClickHouse, Amazon Redshift, Snowflake, and more
### NoSQL & Analytics
MongoDB, Google Analytics 4, PostHog, Mixpanel, Amplitude
### Local & Private
Self-hosted databases, local development instances, secure tunnel connections
See all supported databases and connection methods
## AI-Powered Features
SyneHQ's AI understands your database schema and provides intelligent assistance:
* **Natural Language Processing**: Convert questions to queries automatically
* **Schema Understanding**: AI learns your database structure
* **Context Awareness**: Maintains conversation context across queries
* **Query Optimization**: Automatic performance tuning and suggestions
Learn how to use natural language queries effectively
## Deployment Options
### Cloud-Hosted (SaaS)
* **Fastest setup**: Start querying in minutes
* **Managed infrastructure**: Automatic updates and maintenance
* **Global availability**: Access from anywhere
* **Starting at \$29/user/month**
### Self-Hosted (Enterprise)
* **Complete control**: Deploy in your environment
* **Data sovereignty**: Data never leaves your infrastructure
* **Customization**: Modify and extend as needed
* **Enterprise compliance**: Meet strict regulatory requirements
### Hybrid
* **Best of both worlds**: Cloud convenience with local data control
* **Secure tunneling**: Connect local databases via Rabbit CLI
* **Flexible deployment**: Mix cloud and on-premise data sources
Detailed setup instructions for all deployment options
## Use Cases
### Business Teams
* **Marketing**: Campaign performance analysis and ROI measurement
* **Sales**: Customer segmentation and churn prediction
* **Finance**: Revenue analysis and financial reporting
* **Operations**: Supply chain optimization and efficiency metrics
### Technical Teams
* **Data Engineers**: Focus on pipelines, not ad-hoc queries
* **Developers**: Debug data issues without waiting for DBAs
* **DevOps**: Monitor system performance and health metrics
* **Analysts**: Spend more time on insights, less on query writing
***
SyneHQ democratizes data analytics by combining AI power with universal database connectivity. Whether you're a business user seeking insights or a technical team building data solutions, SyneHQ provides the tools you need to unlock the value in your data. Available as a managed SaaS platform or enterprise self-hosted solution.
# Quick Start
Source: https://docs.synehq.com/get-started/quickstart
Set up your first connection and get insights in minutes
![]() ## Who this is for
* **New users** who want to see value in minutes
* **Teams evaluating SyneHQ** for SaaS or enterprise self-hosting
* **Stakeholders** who want a fast, realistic demo path
You can use SyneHQ as a managed SaaS or deploy it in your own environment (enterprise). This quick start focuses on the fastest SaaS path, with notes for self-hosted where relevant.
## Step 1 — Sign in
1. Go to `https://data.synehq.com`
2. Create an account or sign in
3. Complete the onboarding tour (optional)
Create your SyneHQ account
Learn what SyneHQ can do
## Step 2 — Connect a data source (2 minutes)
1. Go to `Home → Connections`
2. Click `Add connection`
3. Choose your database (e.g., PostgreSQL, MySQL, MongoDB)
4. Enter host, database, user, and password
5. Click `Test` then `Save`

Prefer a guided setup? Use the help in `Home → Connections` for a step‑by‑step tour.
Full list of SQL, NoSQL, and analytics sources
## Setp 3 - Ask your first question
1. Go to `Chat → Chat Input`
2. Select your connection of choice
3. In the ask box, type: "Show me a heatmap of trip density by neighbourhood"
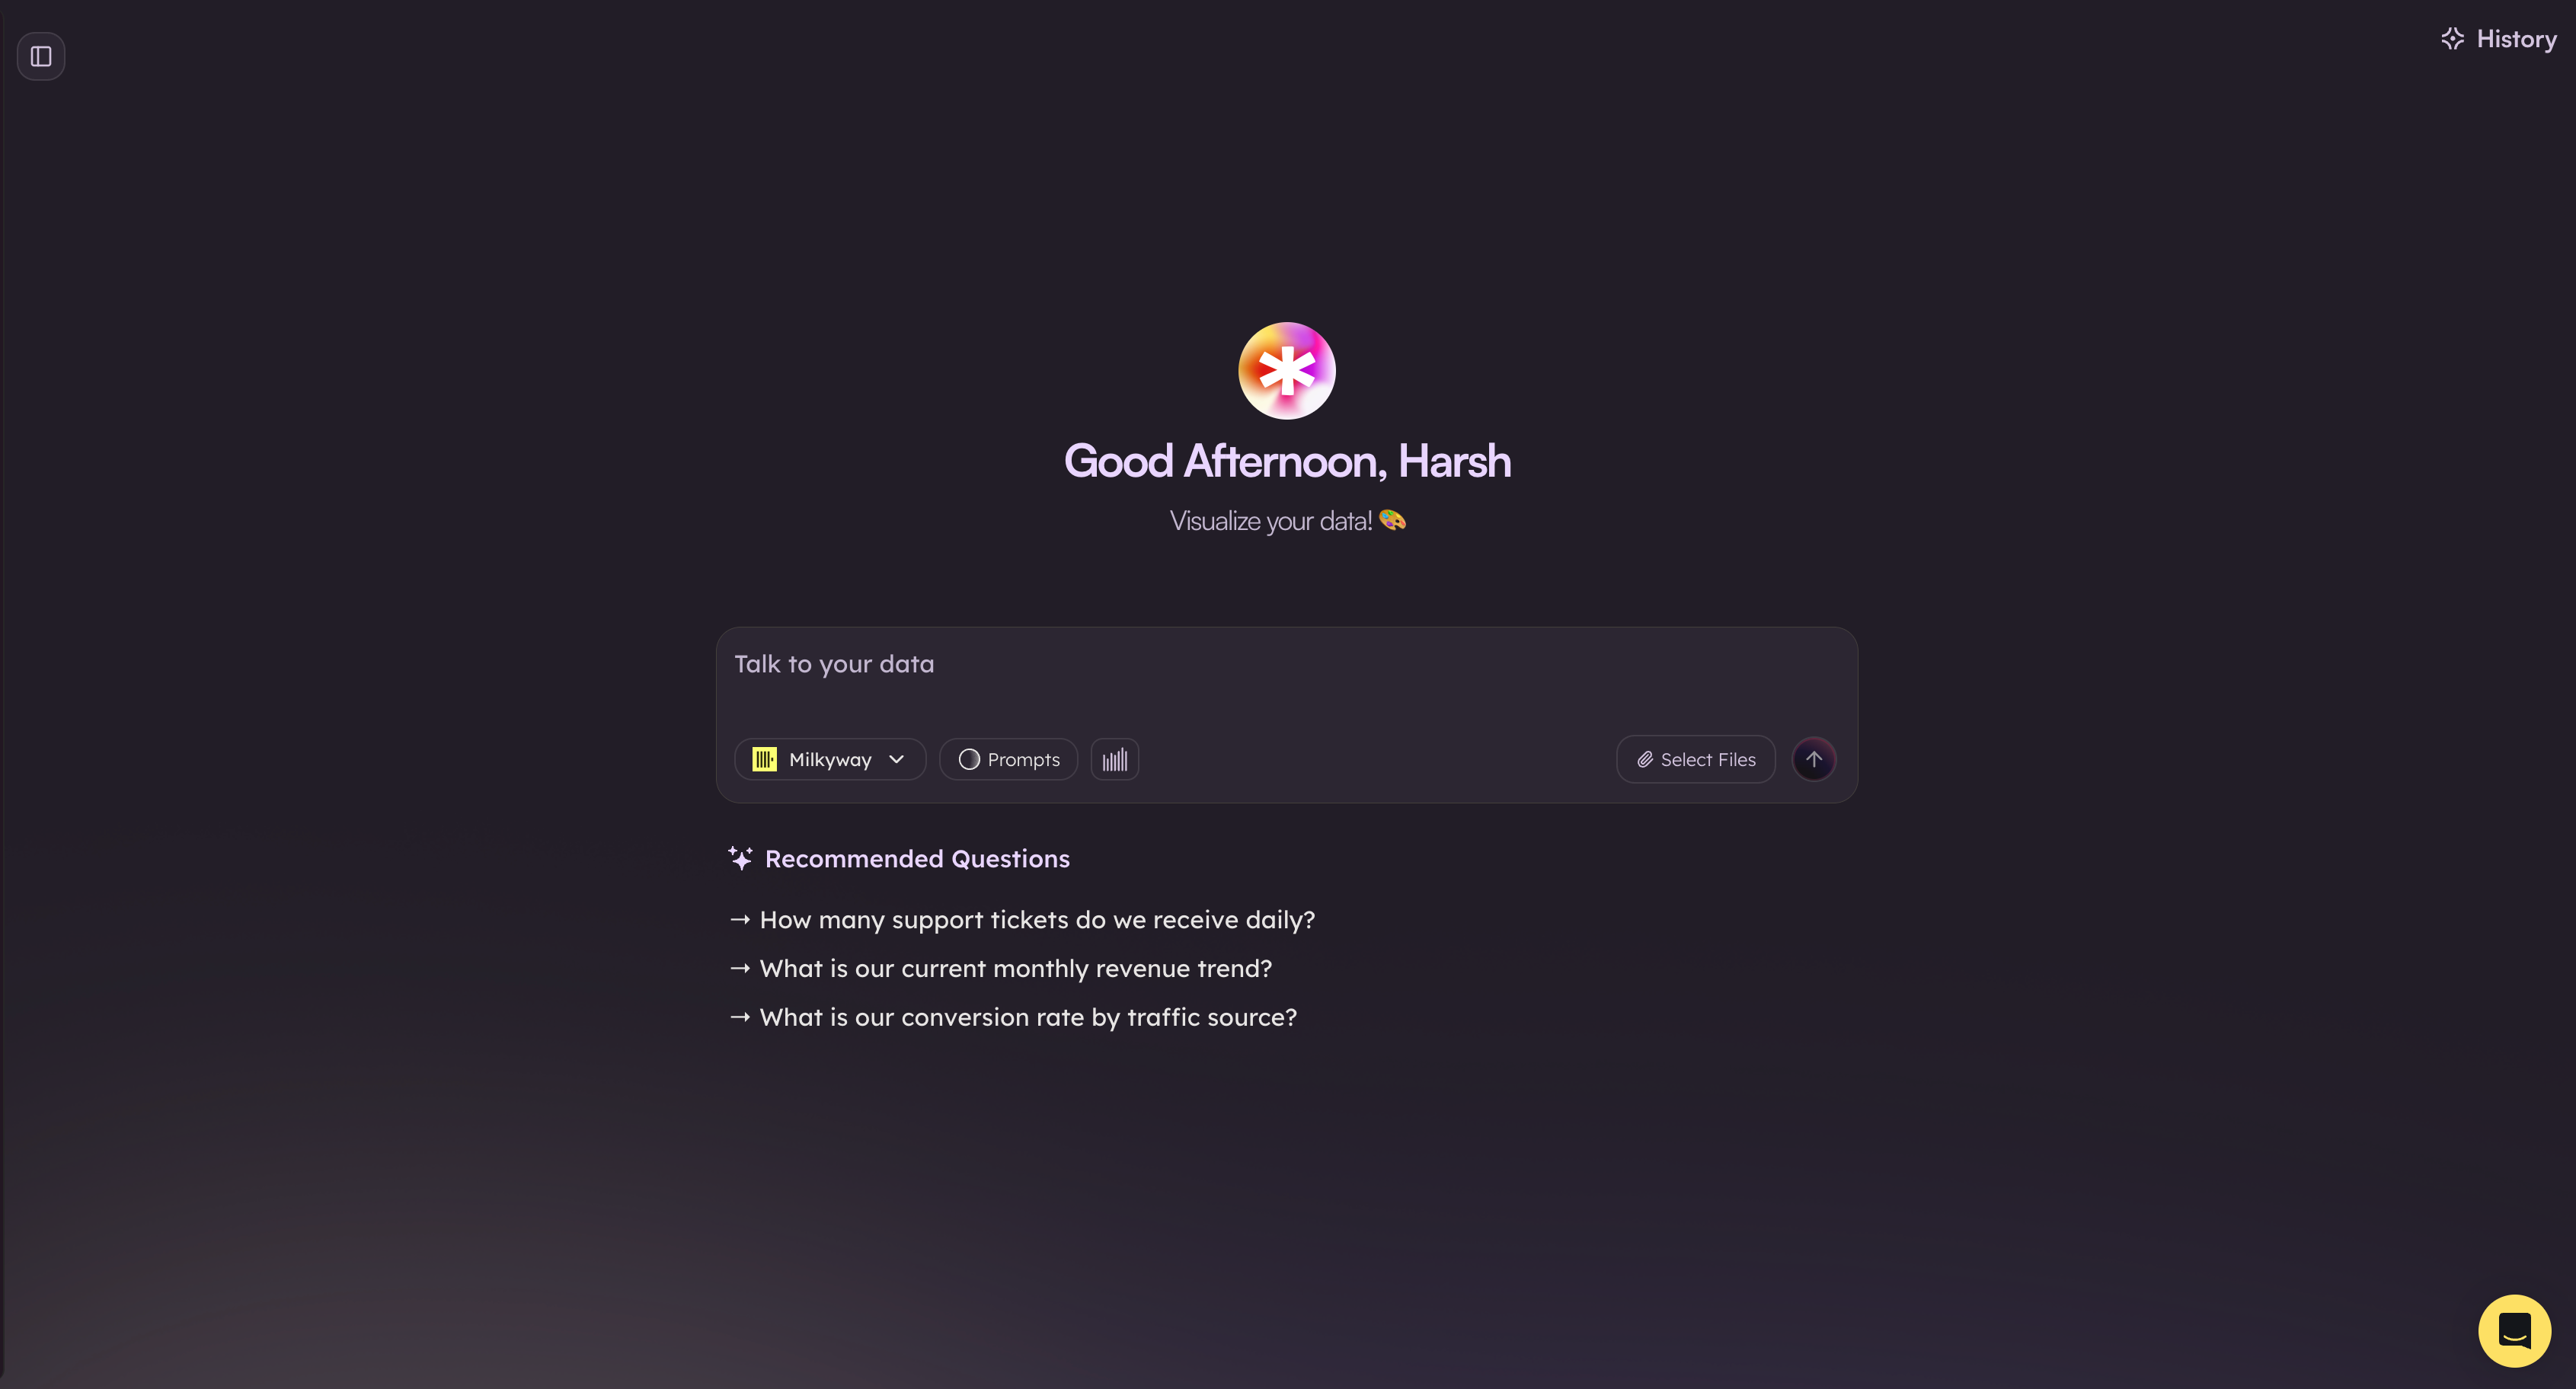
## Step 4 — Ask your first database query
1. Go to `Console → Queries`
2. In the ask box, type: "Show me total revenue by month"
3. Select your connection, then run
4. Review the generated SQL and results
```sql theme={"system"}
-- Example SQL the AI may generate
SELECT DATE_TRUNC('month', order_date) AS month,
SUM(amount) AS total_revenue
FROM orders
GROUP BY month
ORDER BY month;
```
Tips for better natural language questions
## Step 4 — Visualize and share
1. Click `Visualize` and choose a chart type
2. Save as a `Dashboard` (name it "Revenue Overview")
3. Share with your team using access controls
From query to chart in one click
SaaS, self‑hosted (enterprise), or hybrid
## Optional — Self-hosted quick path (enterprise)
* Deploy the app, then repeat Steps 2–4 inside your environment
* Use secure tunneling for local/private databases
* Integrate SSO and enterprise RBAC
Install with Docker, Compose, or Kubernetes
## Troubleshooting
* **Connection failed**: Verify host/port, network/firewall, and credentials
* **SSL errors**: Ensure correct certificates or disable verify in dev
* **No tables found**: Check DB permissions for the SyneHQ user
* **Slow queries**: Start with smaller tables; see performance tips
Connection strings, security, and tuning
Caching, indexing, and scaling options
## Next steps
* Connect more sources (PostgreSQL + MongoDB + ClickHouse)
* Try cross‑database joins ("Compare web and app users")
* Build a team dashboard and schedule reviews
* Set up SSO and roles for your organization
Add more connections
Query smarter with natural language
Choose SaaS or enterprise self-hosted
# AI Query Examples
Source: https://docs.synehq.com/guides/ai/examples
Natural language query examples across different industries
These examples show how to use natural language queries in SyneHQ across different industries and use cases. Simply type these questions into the AI query interface and let SyneHQ generate the SQL and visualizations for you.
## Banking & Finance
* "Show me the top 10 transactions by amount for last month"
* "List all credit card transactions flagged as suspicious in the last 7 days"
* "What's the average transaction value by payment method this quarter?"
* "Find customers with unusual spending patterns compared to their history"
* "How many new customer accounts were opened this quarter?"
* "Which customers have the highest account balances?"
* "Show customer acquisition trends by month for 2024"
* "List customers who haven't made transactions in 90 days"
* "Summarize revenue by product line for 2024"
* "Compare loan approval rates between branches"
* "What's our month-over-month growth in deposits?"
* "Show fee income breakdown by service type"
## E-commerce & Retail
* "Which products had the highest sales in August?"
* "Compare average order value between weekdays and weekends"
* "Show sales trends by category for the last 6 months"
* "Find our best-selling products by region"
* "List all customers who made more than 5 purchases in the last month"
* "What's the average time between first visit and first purchase?"
* "Show customer lifetime value by acquisition channel"
* "Find customers who abandoned their carts in the last week"
* "Find inventory items with less than 10 units in stock"
* "Which products are moving slowest this quarter?"
* "Show warehouse utilization rates by location"
* "List products that need to be reordered this week"
## Healthcare
* "How many appointments were scheduled last week by department?"
* "Show trends in patient admissions by diagnosis for 2023"
* "List patients due for follow-up appointments this month"
* "Find patients with upcoming procedure reminders"
* "Find doctors with the shortest average patient wait times"
* "Show bed occupancy rates by department"
* "What's our patient satisfaction score by facility?"
* "List equipment due for maintenance this quarter"
* "Show treatment outcomes by procedure type"
* "Compare readmission rates between departments"
* "Find the most common diagnoses this month"
* "Show medication usage trends by therapeutic area"
## SaaS & Technology
* "Show user growth trends over the past six months"
* "List accounts with trial periods expiring this week"
* "What's our monthly recurring revenue by plan type?"
* "Find users who haven't logged in for 30 days"
* "Which features are used most frequently by enterprise customers?"
* "Show daily active users by geographic region"
* "Find our highest-engagement user cohorts"
* "What's the average session duration by user type?"
* "How many API errors occurred by endpoint in the last 24 hours?"
* "Show application response times by service"
* "List the most common error types this week"
* "Find servers with highest CPU utilization"
## Human Resources
* "Show employee attrition rate by department"
* "List upcoming work anniversaries for this month"
* "Count remote vs onsite employees as of today"
* "What's our average time-to-hire by position level?"
* "Show performance review scores by team"
* "Find employees eligible for promotion this cycle"
* "What's our employee satisfaction score by department?"
* "List training completion rates by program"
* "Show headcount trends by quarter for 2024"
* "Find departments with the highest overtime costs"
* "What's our diversity ratio by management level?"
* "List open positions by priority and department"
## Marketing & Advertising
* "Show conversion rates by campaign for August"
* "Summarize ad spend and ROI by channel"
* "Which campaigns brought in the most new subscribers last week?"
* "Compare email open rates across different segments"
* "Show lead quality scores by source"
* "Find our highest-converting landing pages"
* "What's our cost per acquisition by marketing channel?"
* "List leads that need follow-up this week"
* "Which blog posts generated the most traffic last month?"
* "Show social media engagement rates by platform"
* "Find our most-shared content by topic"
* "What's our average time on page by content type?"
## Supply Chain & Logistics
* "Show shipments delayed by more than two days last quarter"
* "Summarize number of deliveries completed by each driver"
* "List orders currently stuck in transit"
* "What's our on-time delivery rate by region?"
* "Find suppliers with the best delivery performance"
* "Show procurement costs by category this year"
* "List overdue purchase orders by supplier"
* "What's our supplier quality rating by vendor?"
* "Show warehouse capacity utilization by location"
* "Find the fastest-moving products this month"
* "List items with picking accuracy below 95%"
* "What's our average order fulfillment time?"
## Education
* "List top performing students by test scores in spring semester"
* "Show grade distribution by course and instructor"
* "Find students at risk based on attendance patterns"
* "What's our graduation rate by program?"
* "Summarize attendance by grade for the current academic year"
* "How many students enrolled in each course last term?"
* "Show enrollment trends by department over 5 years"
* "List classes with the highest drop rates"
* "Find classrooms with the highest utilization rates"
* "Show library book checkout trends by subject"
* "What's our student-to-faculty ratio by department?"
* "List equipment requests pending approval"
## Getting Started with AI Queries
Ready to try these examples? Here's how to get the best results from natural language querying in SyneHQ.
* **Start simple**: Begin with basic questions about familiar data
* **Use business terms**: Speak naturally using your industry terminology
* **Be specific**: Include time ranges and filters for more precise results
* **Ask follow-ups**: Build on previous queries to dive deeper
* **Time periods**: "last month", "this quarter", "past 6 months"
* **Comparisons**: "compare", "versus", "difference between"
* **Aggregations**: "total", "average", "count", "sum"
* **Sorting**: "top", "highest", "lowest", "best performing"
1. **Connect your data sources** to SyneHQ
2. **Try a simple query** from your industry examples above
3. **Review the generated SQL** to understand what happened
4. **Ask follow-up questions** to explore deeper
5. **Save useful queries** for your team to reuse
Open the SyneHQ console and try these examples with your data
# Configure a Cloudflare D1 connection
Source: https://docs.synehq.com/guides/connections/d1
This guide explains how to create a Cloudflare API token with D1 read or edit access, how to find your Account ID and Database ID, and how to use them to add a new connection in SyneHQ.
## Prerequisites
* A Cloudflare account with access to the target account (and D1 enabled).
* The D1 database already created in your Cloudflare dashboard.
## Step 1: Create a Cloudflare API token
1. Sign in to the Cloudflare dashboard and go to **My Profile → API Tokens → Create Token**.
2. Choose **Create Custom Token** (or a D1 template if available) and give it a descriptive name such as **SyneHQ D1 Access**.
### Permissions for read-only access
* Add permission: **Account → Cloudflare D1 Databases → Read**.
* (Optional) Scope the token to a single account by selecting the specific **Account** under **Account Resources**.
### Permissions for read/write access
* Add permission: **Account → Cloudflare D1 Databases → Edit**.
* (Optional) Again, scope it to a single **Account** for least‑privilege access.
Then:
1. Set an **Account** under **Resources** to limit where this token applies.
2. Click **Continue to summary → Create Token**, then copy the generated token value and keep it somewhere secure; you will paste it into the **Cloudflare API Token** field in SyneHQ.
## Step 2: Find your Account ID and Database ID
### Locate Cloudflare Account ID
1. In the Cloudflare dashboard, open **Overview** for any site in the target account.
2. In the right sidebar, copy the **Account ID**; this is the value SyneHQ expects in the **Cloudflare Account ID** field.
### Locate D1 Database ID
1. Navigate to **Workers & Pages → D1** (or the D1 section under **Data** in Cloudflare).
2. Open your D1 database and copy its **Database ID** (sometimes labeled as **UUID** for the database); paste this later into the **Database ID** field in SyneHQ.
## Step 3: Add the connection in SyneHQ
In the SyneHQ UI, open the **Cloudflare D1** connection form.
![2025 12 22 18 03 24]() Fill in the fields as follows:
* **Name**: Any label you like for this connection (for example, `YIELDING_TURTLE`).
* **Database ID**: Paste the D1 Database ID copied from Cloudflare.
* **Cloudflare Account ID**: Paste the Account ID from the Cloudflare overview page.
* **Cloudflare API Token**: Paste the token you created in Step 1 (with Read or Edit permissions for D1).
Then click **Test Connection**; if it succeeds, click **Connect** to save the new Cloudflare D1 connection.
## Step 4: Allow SyneHQ’s IP if you use IP restrictions
If your Cloudflare or database setup uses IP‑based restrictions, add SyneHQ’s fixed IP address to your allowlist before testing the connection. The connection form displays the current **Our IP address is: 98.84.82.59** banner; copy this IP and whitelist it wherever you enforce network access controls (for example, firewall rules or Cloudflare Access lists).
# Connect AWS S3
Source: https://docs.synehq.com/guides/storages/aws-s3
How to generate credentials and configure Connect AWS S3 storage destinations in Syne.
Amazon S3 is the canonical S3 implementation; you connect it by creating a bucket and an IAM user with access keys scoped to that bucket.
### Step 1 – Create an S3 bucket
* In the AWS console, go to **S3 → Buckets → Create bucket**.
* Choose:
* **Bucket name**: For example `syne-s3-data`.
* **AWS Region**: For example `us-east-1`.
* Block all public access unless you explicitly need public objects; Syne can work with private buckets.
### Step 2 – Create an IAM user and access keys
Create an IAM user dedicated to Syne and grant it least-privilege access to the bucket.
* Open the **IAM** console → **Users → Create user**.
* Name the user (for example `syne-storage`), and choose **Access key – Programmatic access** as the credential type (varies slightly in new UI).
* Attach a policy that gives access to your bucket only. You can:
* Use AWS managed policies like **AmazonS3ReadOnlyAccess** (for read-only) or **AmazonS3FullAccess** (for testing), **or**
* Create a custom policy that limits access to `arn:aws:s3:::syne-s3-data` and `arn:aws:s3:::syne-s3-data/*`.
* After creating the user, open the user → **Security credentials → Access keys**.
* Click **Create access key**, choose the use case **Other**, and finish the wizard.
* Copy:
* **Access key ID** – to use as **Access Key** in Syne.
* **Secret access key** – to use as **Secret Key** in Syne.\
These are shown only once; download the CSV or store them securely.
### Step 3 – Fill out the Syne storage form (S3)
![2025 12 22 11 38 33]() For a standard Amazon S3 connection, set:
* **Storage Name**
* Any label, for example `AWS_S3_PRIMARY`.
* **Bucket Name**
* Your S3 bucket name, e.g. `syne-s3-data`.
* **Endpoint**
* Leave blank to let the SDK use the default S3 endpoint for the chosen region, or explicitly set `https://s3..amazonaws.com` (for example `https://s3.us-east-1.amazonaws.com`).
* **Region**
* Your bucket’s AWS region, e.g. `us-east-1`.
* **Access Key**
* The IAM user’s **Access key ID**.
* **Secret Key**
* The IAM user’s **Secret access key**.
* **Path Prefix (optional)**
* Optional prefix like `syne/` inside the bucket.
* **Public**
* Keep **off** by default; Syne does not require public buckets. Control access via IAM and S3 bucket policies.
***
## Security best practices
* Use dedicated credentials (service account / IAM user / R2 token) per environment (dev, staging, prod).
* Grant only the permissions Syne needs (typically list, read, and write for a single bucket).
* Rotate access keys periodically and remove unused keys or tokens.
# Connect a Google Cloud Storage bucket via S3
Source: https://docs.synehq.com/guides/storages/gcs
How to generate GCS HMAC credentials and configure them in Syne using the S3-compatible endpoint.
Configure a **Google Cloud Storage (GCS)** bucket as an S3-compatible storage destination in Syne without making the bucket public and while keeping fine‑grained access control enabled.
## What you’ll need
* A Google Cloud project with Cloud Storage enabled.
* Permission to create buckets and manage service accounts in that project.
***
## Step 1 – Create a private GCS bucket (fine‑grained)
1. In the Google Cloud console, go to **Cloud Storage → Buckets → Create**. \[web:4]
2. Choose:
* **Bucket name**: A globally unique name, for example `syne-analytics-data`. This exact name will go into the **Bucket Name** field in Syne.
* **Location**: Pick your preferred region (for example `us-east1`).
3. In **Access control**, select **Fine-grained** so you can manage access at the object level and use S3-compatible ACLs.
4. Leave **Public access** disabled. Do not add any “public” or `allUsers` permissions.
Your bucket is now private and uses fine‑grained access control.
***
## Step 2 – Create HMAC (S3-style) access keys in GCS
GCS exposes S3-compatible credentials via **HMAC keys** in the Interoperability settings. \[web:20]
* In the Google Cloud console, go to **Cloud Storage → Settings → Interoperability**.
* Under **Service account HMAC**, choose the service account that Syne should use, then click **Create key**.
* Copy the generated values:
* **Access key** – this goes into Syne’s **Access Key** field.
* **Secret** – this goes into Syne’s **Secret Key** field. The secret is shown only once, so store it securely (for example in a password manager).
* Make sure the service account has the right roles on your bucket, such as:
* `Storage Object Viewer` for read-only.
* `Storage Object Admin` for read/write.
* To rotate a key, create a new HMAC key, update Syne with the new **Access key** and **Secret**, then disable or delete the old key in the Interoperability section.
* Avoid having unused active keys to reduce the blast radius of a credential leak.
***
## Step 3 – Fill out the Syne storage form
Open **Storages(**`Click here`**) → Add Storage** in Syne and use the following values.
![2025 12 22 11 38 33]() ### Basic fields
* **Storage Name**
* Any internal label in Syne, for example `MAGNIFICENT_GOOSE`.
* **Bucket Name**
* The exact GCS bucket name created in Step 1, for example `syne-analytics-data`.
* **Endpoint**
* Use the GCS XML (S3-compatible) endpoint:
* `https://storage.googleapis.com`
* **Region**
* For GCS via S3 clients, a synthetic region like `auto` is typically used; follow the Syne UI hint for GCS (for example `auto`).
### Credentials
* **Access Key**
* Paste the **Access key** from the HMAC key you created in Step 2.
* **Secret Key**
* Paste the **Secret** from the same HMAC key.
### Advanced
* **Path Prefix (optional)**
* Leave empty to write at the bucket root, or set a prefix such as `syne/` to keep all Syne data under a folder‑like path.
* **Public**
* Keep this **off**. Syne will not mark objects as publicly readable; access is controlled by IAM and object ACLs instead.
* **Is this a GCS bucket?**
* Turn this **on** if the toggle is available so Syne knows to use the GCS S3-compatible endpoint instead of AWS S3.
***
## Step 4 – Keep the bucket private and secure
* Do **not** grant `allUsers` or `allAuthenticatedUsers` roles at the bucket or object level; that would make data public or broadly accessible.
* Prefer service-account HMAC keys over user keys, and restrict the service account to the minimum roles required (`Storage Object Viewer` or `Storage Object Admin`).
* Rotate HMAC keys periodically and remove unused keys in the **Interoperability** settings.
# Connect Cloudflare R2
Source: https://docs.synehq.com/guides/storages/r2
How to generate credentials and configure Cloudflare R2 as S3-compatible storage destinations in Syne.
You can connect **Cloudflare R2** as S3-compatible storage in Syne by creating buckets, generating access credentials, and filling out the storage form.
***
Cloudflare R2 is fully S3-compatible, so you connect it by creating an R2 bucket, generating an R2 API token (Access Key / Secret), and using the R2 S3 endpoint.
### Step 1 – Create an R2 bucket
1. In the Cloudflare dashboard, go to **R2 → Object Storage**.
2. Click **Create bucket**, choose a **bucket name** (for example `syne-r2-data`), and finish the wizard.
3. Keep the bucket private by default; do not enable public access unless you explicitly need it.
### Step 2 – Generate S3 API credentials (Access Key / Secret)
R2 uses **API tokens** that map to S3-compatible **Access Key ID** and **Secret Access Key** values.
* In the Cloudflare dashboard, go to **R2 → Object Storage → Manage R2 API Tokens**.
* Click **Create API Token** and choose a template that grants access only to the buckets Syne should use (least privilege).
* After creation, Cloudflare will show you:
* **Access Key ID**
* **Secret Access Key**\
These are displayed once; copy and store them securely.
Use these as your **Access Key** and **Secret Key** in Syne.
* In **R2 → Object Storage**, copy your **Account ID** from the overview.
* Open your bucket → **Settings → S3 API**.
* Copy the endpoint URL. It typically looks like:\
`https://.r2.cloudflarestorage.com`\
This is the value for the **Endpoint** field in Syne.
* When a region is required, you can use `auto` or `APAC`, which R2 aliases to its automatic region for S3 compatibility.
### Step 3 – Fill out the Syne storage form (R2)
![2025 12 22 11 38 33]() Use the **S3-compatible** option in Syne and set:
* **Storage Name**
* Any label, for example `R2_BACKUPS`.
* **Bucket Name**
* Your R2 bucket name, e.g. `syne-r2-data`.
* **Endpoint**
* The R2 S3 endpoint: `https://.r2.cloudflarestorage.com`.
* **Region**
* Use `auto` or `APAC` (recommended for R2).
* **Access Key**
* The **Access Key ID** from your R2 API token.
* **Secret Key**
* The **Secret Access Key** from the same token.
* **Path Prefix (optional)**
* Optional folder-like prefix, e.g. `syne/`.
* **Public**
* Keep **off** so objects remain private; manage access through Cloudflare permissions instead.
That's it now, you should be able to dump backup files, uploaded files over to your own buckets.
# Jupyter SQL Extension
Source: https://docs.synehq.com/open-source/jupyter-sql/sql-extension
Effortlessly analyze your SyneHQ-connected data sources from Jupyter notebooks—no credentials required.

## Overview
SyneHQ’s Jupyter SQL Extension brings secure, unified, and credential-free database access to your Jupyter environment. All connections and permissions are managed by SyneHQ’s platform, making analytics and data science simpler, safer, and faster.
* **Zero-Credential Data Access:** No manual credential handling or connection strings.
* **Unified Platform Integration:** All available SyneHQ data sources accessible via magic commands.
* **Enterprise-Grade Security:** RBAC, SSO, audit logging, and query validation.
* **Rich Output Support:** Pandas DataFrames, HTML tables, JSON, and custom charting.
***
## Feature Highlights
## 🔐 Secure Connection Management
* All connections managed by SyneHQ’s API and internal services.
* Credential-free, enterprise authentication (SSO/OAuth supported).
* Automatic connection pooling, retries, and failover.
## 🛡️ Security and Validation
* Advanced SQL injection prevention, dangerous operation detection.
* Queries fully audited and validated.
* Fine-grained access controls match SyneHQ platform RBAC.
## 📊 Rich Output Formatting
* Results as Pandas DataFrames (default).
* HTML tables with sorting/filtering; ideal for reports.
* JSON output for API and automation workflows.
* Easy chart and visualization integration.
## 🔄 Advanced Query Features
* Python variable substitution with intuitive, safe syntax.
* Evaluate expressions, lists, and functions within SQL.
* Named result assignment and direct variable usage.
* Support for async execution and smart query caching.
## 📈 Performance and Monitoring
* Query execution metrics and optimization guidance.
* Connection health checks, retries, and robust error recovery.
***
## Quick Start
1. **Install the extension**
```shellscript theme={"system"}
pip install syne-sql-extension
```
2. **Load the extension in Jupyter**
```python theme={"system"}
%load_ext syne_sql_extension
```
3. **Connect and query**
```python theme={"system"}
%%sql analytics_db
SELECT * FROM users LIMIT 10
```
***
## Using Python Variables
Parameterize your queries safely and expressively:
```python theme={"system"}
user_limit = 50
dept = 'Sales'
%%sql hr_db
SELECT name, email FROM employees WHERE department = {dept} LIMIT {user_limit}
```
Supported substitution for:
* Strings, numbers, lists/tuples, booleans, None (as SQL NULL), datetime objects, safe Python expressions.
Expression evaluation is sandboxed; dangerous patterns (`import`, `eval`, `os`, etc.) are blocked.
***
## Output Formats
```python theme={"system"}
# DataFrame (default):
%%sql sales_db --format dataframe
SELECT product, SUM(revenue) AS total FROM sales GROUP BY product
# HTML table:
%%sql sales_db --format html
SELECT * FROM products WHERE price > 100
# JSON: %%sql api_db --format json
SELECT config FROM settings WHERE active = true
```
Assign result to a variable for downstream analysis/plotting:
```python theme={"system"}
%%sql analytics_db
users_df >> SELECT * FROM users LIMIT 100
```
```python theme={"system"}
# Use as DataFrame in notebook:
users_df.groupby("country")["id"].count().plot(kind="bar")
```
***
## Connection Management
List all available SyneHQ connections:
```python theme={"system"}
%%sql --list-connections
```
Test a connection:
```python theme={"system"}
%%sql my_db_connection
SELECT 1
```
***
## Error Handling & Troubleshooting
* Human-readable exception messages: connection errors, invalid SQL, permission issues.
* All errors are logged with audit trails in SyneHQ.
* Enable debug mode for verbose logs:
```python theme={"system"}
%%sql db --verbose
SELECT * FROM data
```
Common issues:
* Extension not loading: `%load_ext syne_sql_extension` (confirm installation)
* Permissions error: Confirm access in SyneHQ admin UI.
* Network issues: Ensure connectivity to SyneHQ APIs.
***
## Security
* All queries validated/sanitized before submission.
* No secrets or credentials ever present in Python code or notebooks.
* Queries, errors, and outputs are fully audited via SyneHQ.
Blocked dangerous queries, e.g.:
```python theme={"system"}
user_input = "'; DROP TABLE users; --" # blocked
%%sql db
SELECT * FROM users WHERE name = '{user_input}'
```
Safe queries use parameter binding:
```python theme={"system"}
user_input = "Jane Doe"
%%sql --connection-id db
SELECT * FROM users WHERE name = {user_input}
```
***
## Advanced Usage
Async and cached queries:
```python theme={"system"}
%%sql db --cache
SELECT expensive_query() FROM big_table
```
Example: Assign results, plot, and visualize:
```python theme={"system"}
%%sqlconnect analytics_db
sales >> SELECT category, SUM(amount) AS total FROM orders GROUP BY category
```
```python theme={"system"}
sales.plot.bar(x="category", y="total")
```
***
## Support and Contributions
* **Documentation:** [docs.synehq.com](https://docs.synehq.com/)
* **Source Code:** [GitHub](https://github.com/SyneHQ/jupyter-sql-extension)
* **Issues & Feature Requests:** [GitHub Issues](https://github.com/SyneHQ/jupyter-sql-extension/issues)
* **Email Support:** [support@synehq.com](mailto:support@synehq.com)
***
**Made with ❤️ by the SyneHQ team**\
*Secure, seamless analytics for every data scientist.*
***
# Security
Source: https://docs.synehq.com/security
How SyneHQ protects your data in SaaS and enterprise self‑hosted
SyneHQ is designed with a privacy‑by‑default architecture: queries execute in your environment, and we maintain a zero‑data‑footprint model for SaaS. Enterprise self‑hosting offers full control over data location, keys, and runtime.
## Data handling
| Topic | SaaS | Self‑Hosted (Enterprise) |
| --------------- | ---------------------------------------- | ------------------------ |
| Query execution | In your DBs; no data persisted by SyneHQ | In your environment |
| Result caching | Ephemeral, encrypted, configurable | Customer‑controlled |
| Logs & metrics | Metadata only; no sensitive payloads | Customer‑controlled |
## Encryption
> Native integration with **Infisical** for secrets lifecycle and encryption key management
* TLS 1.2+ for all client ↔ server and server ↔ data‑source traffic
* Strong cipher suites; HSTS on public endpoints
* SaaS: encrypted volumes and key management via CSP KMS
* Self‑hosted: use your KMS/HSM; enable disk/database encryption
* Rotated regularly; scoped, least‑privilege keys
* Option to integrate with customer KMS (enterprise)
## Identity & access
| Control | Details |
| ----------------- | ------------------------------------------------------- |
| SSO | SAML / OIDC (OAuth2) integrations |
| RBAC | Least‑privilege roles at org, space, resource levels |
| SCIM (enterprise) | Automated provisioning and de‑provisioning |
| Session security | Short‑lived tokens, refresh rotation, device revocation |
## Auditing
* Authentication and admin actions
* Connection and permission changes
* Query runs and dashboard shares (metadata only)
* Streaming to SIEM (enterprise): Splunk, Datadog, ELK
* Configurable retention policies (enterprise)
## Compliance
| Standard | Coverage |
| -------------------- | ------------------------------------------------------ |
| SOC2 Type II | Controls, continuous monitoring, third‑party audits |
| GDPR | DPA, sub‑processor transparency, user rights workflows |
| HIPAA (enterprise) | BAAs, technical and administrative safeguards |
| PCI DSS (enterprise) | Segmented processing and hardened controls |
## Network security
* WAF, DDoS protection, rate limiting
* Strict CORS and CSP
* Use **Local Connections** via the Rabbit tunnel for on‑prem/private DBs
* IP allow‑listing and VPC/VNet peering options (enterprise)
## Secrets & configuration
* Encrypted secrets storage; no plaintext in logs
* Per‑connection least‑privilege DB users recommended
* Optional customer‑managed secrets providers (enterprise)
* First‑class support for **Infisical** for centralized secrets, environment configs, and automatic rotation
Infisical can be used in both SaaS and self‑hosted deployments to manage application secrets, database credentials, and encryption keys. Typical setup: sync SyneHQ environment variables and connection credentials from Infisical projects and use just‑in‑time decryption at runtime.
## Secure deployments
SaaS, enterprise self‑hosted, or hybrid
Query private data via secure tunnels
KMS & secrets management used with SyneHQ
Need a tailored security review or questionnaires (CAIQ, SIG)? Contact our enterprise team.
# Usage Patterns
Source: https://docs.synehq.com/use-cases/usage-patterns
Common ways teams use SyneHQ across workflows and industries
Explore practical, high‑impact ways to use SyneHQ. These patterns combine natural‑language querying, federated analytics, dashboards, and secure collaboration to accelerate decisions—without ETL.
## Patterns
SyneHQ connects to databases and analytics tools so you can analyze everything in one place.
Key benefit: Consolidate disparate data into a single analysis surface—no pipelines required.
* Blend CRM + product analytics + billing
* Join operational DBs with CSV/JSON/Parquet on the fly
* Use Tangent Lake for cross‑engine joins
Supported connectors and connection methods
Query across Postgres, MySQL, files, and more
Build dashboards that refresh automatically and set up notifications for threshold breaches.
Key benefit: Always know when key metrics move—no manual checks.
* Team dashboards for daily/weekly reviews
* Slack/email alerts on KPI deviations
* Drill‑downs from cards to source queries
Create charts and dashboards from queries
Use natural language to get SQL, iterate quickly, and learn from the generated queries.
Key benefit: Answer follow‑ups in seconds; share the exact SQL behind each insight.
* Ask: "Show revenue by month for premium plans"
* Refine: "Filter to last 90 days and include churn rate"
* Compare: "Month‑over‑month change vs previous quarter"
Tips for better NLQ and optimization
Share queries, dashboards, and Tangents with precise permissions.
Key benefit: Empower teams while protecting sensitive data with RBAC and audit trails.
* Role‑based access to sources and folders
* Share read‑only dashboards to stakeholders
* Version and reuse query building blocks
How RBAC, encryption, and auditing fit in
Concrete ways different teams apply SyneHQ.
Key benefit: Ready‑to‑run ideas to prove value fast.
* Finance: anomaly detection, revenue reconciliation, risk metrics
* Product & Marketing: funnel analysis, cohort retention, attribution
* Logistics & Manufacturing: inventory turns, on‑time delivery, scrap rate
* E‑commerce: LTV by segment, cart abandonment cohorts, promo ROI
Copy‑paste SQL for cross‑source insights
Keep data in your environment (self‑hosted) or use SaaS with zero data footprint.
Key benefit: Meet SOC2/GDPR requirements without slowing teams down.
* Local/private access via secure tunnel (Rabbit CLI)
* No ETL copies; query sources live
* Auditable access and query history
Secure tunnels for on‑prem and local data
SaaS, enterprise self‑hosted, or hybrid
## Summary table
| Pattern | Primary benefit |
| ----------------------------- | ------------------------------------ |
| Connect multiple sources | Unified analysis without pipelines |
| Real‑time KPI monitoring | Immediate awareness of changes |
| Interactive exploration (NLQ) | Faster answers with transparent SQL |
| Collaboration with RBAC | Secure sharing and reuse |
| Industry playbooks | Proven ideas to ship value fast |
| Security & compliance | Private by default, auditable access |
## Next steps
Connect a source and run your first query
The federated query lake powering cross‑engine joins
Explore supported connectors